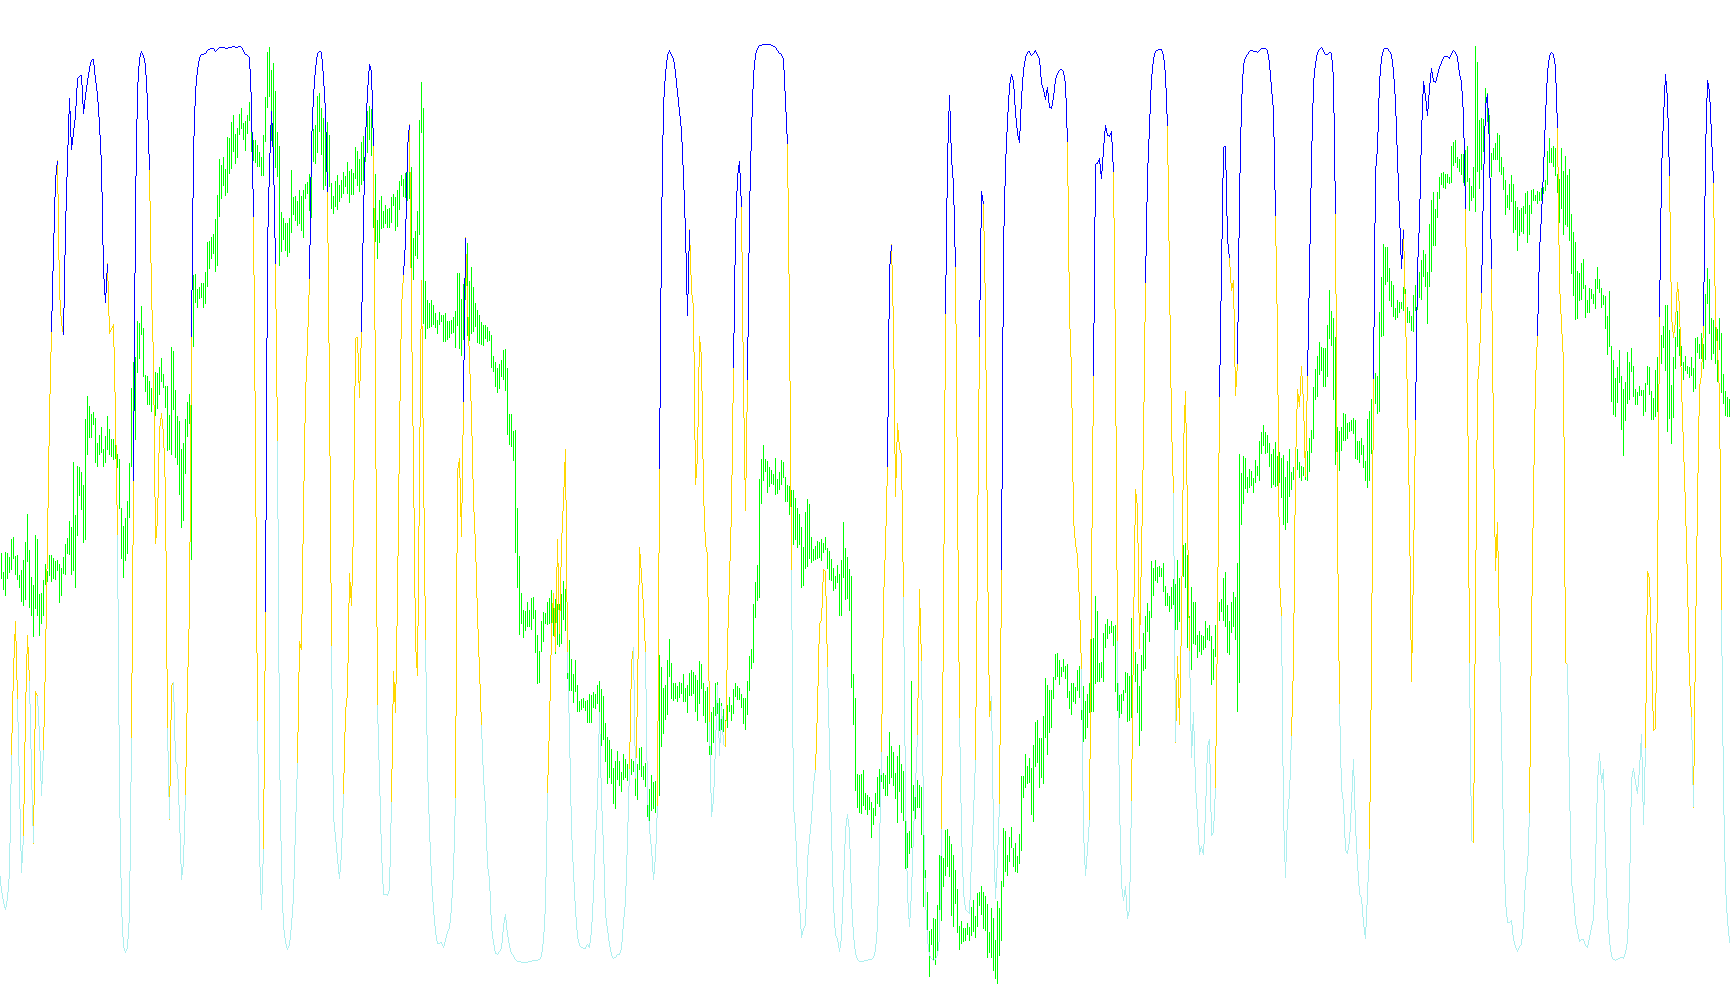
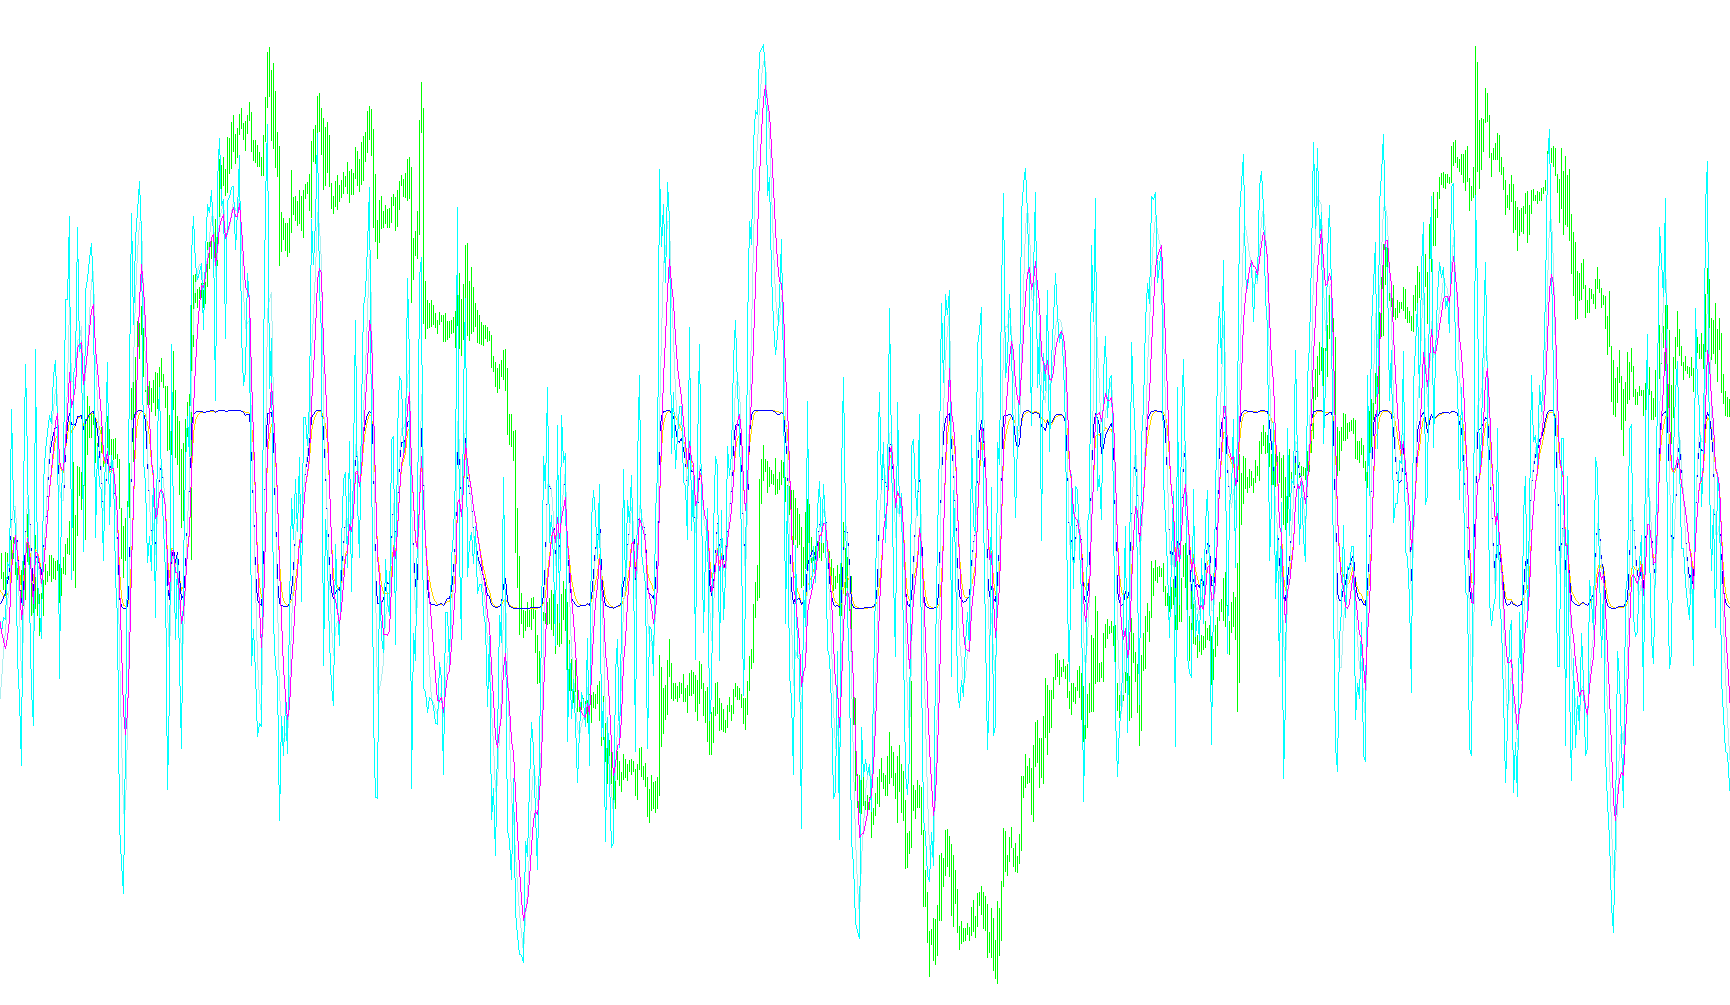
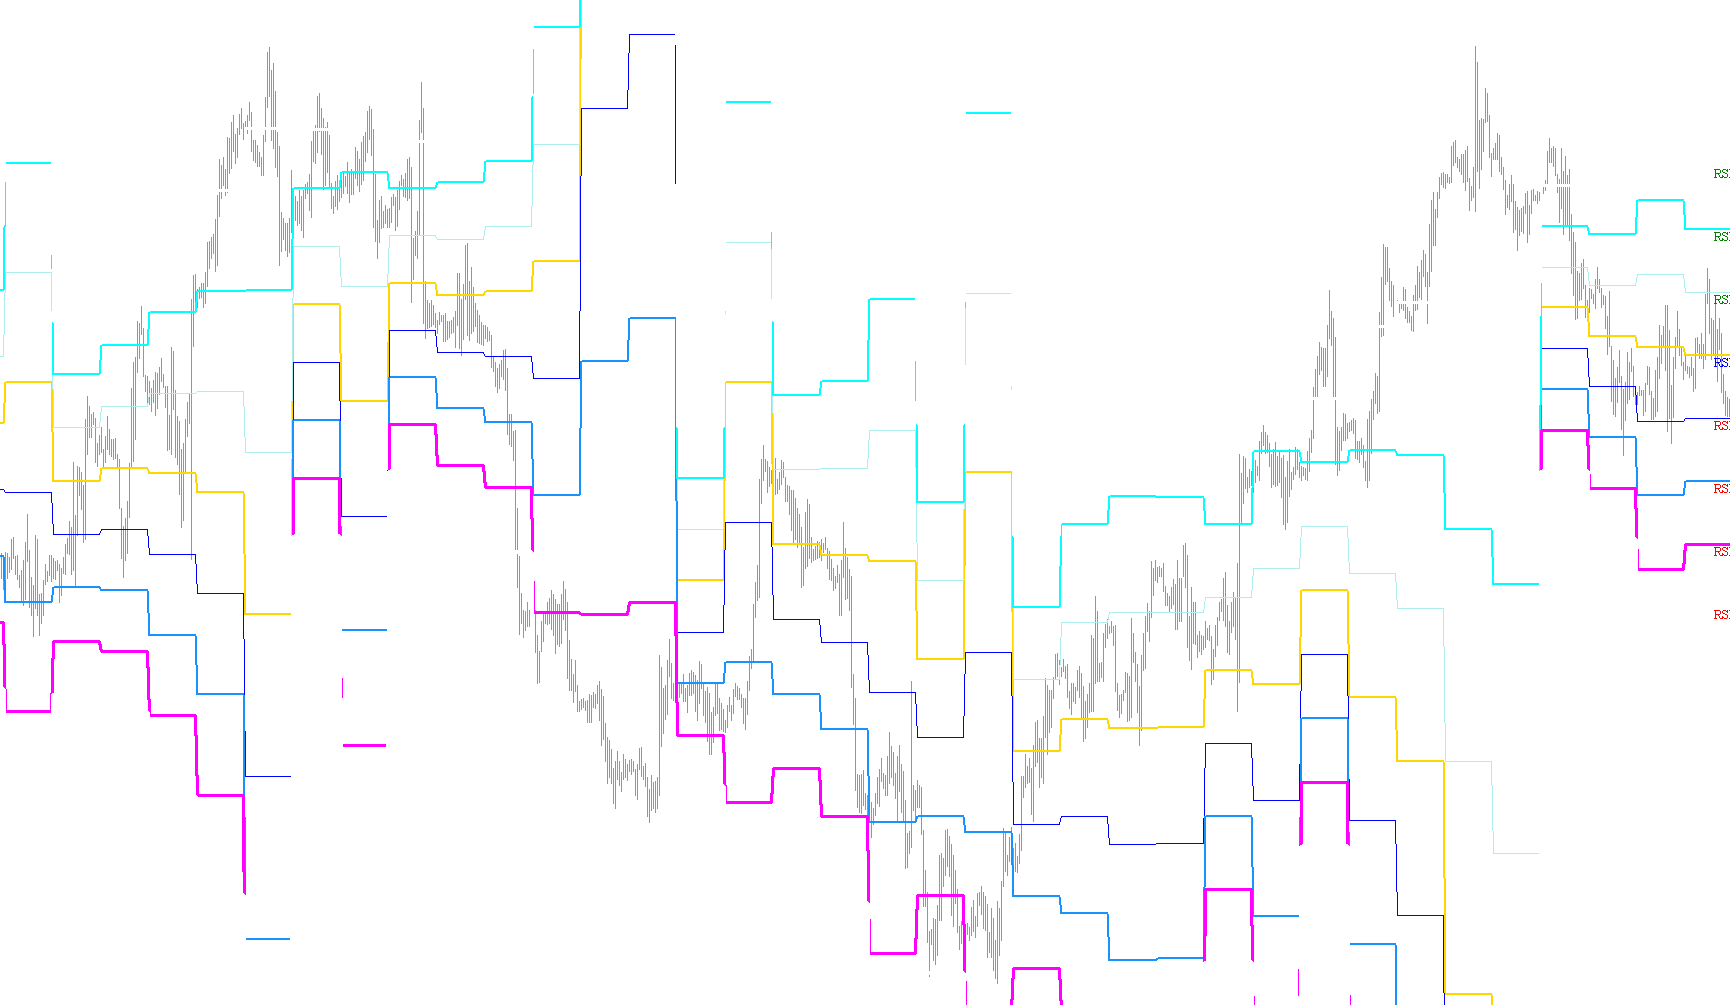
TDIVA cja
Indicator

TDIVA cja

iMAOnArrayiRSI

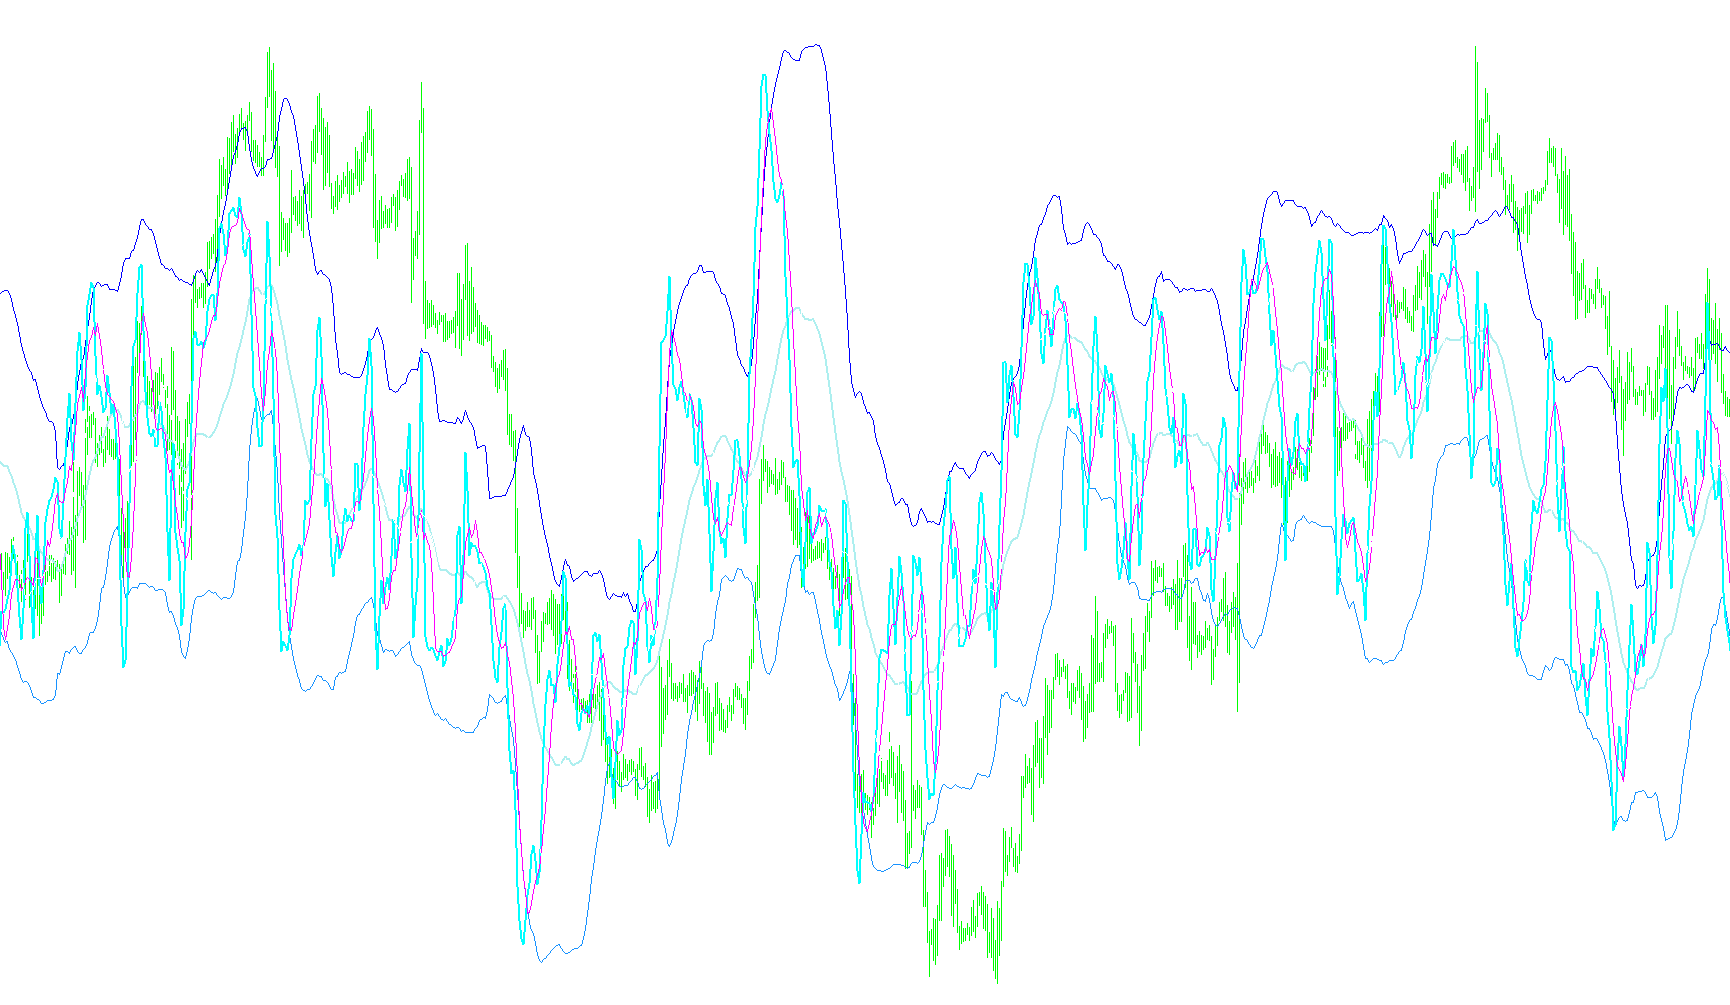
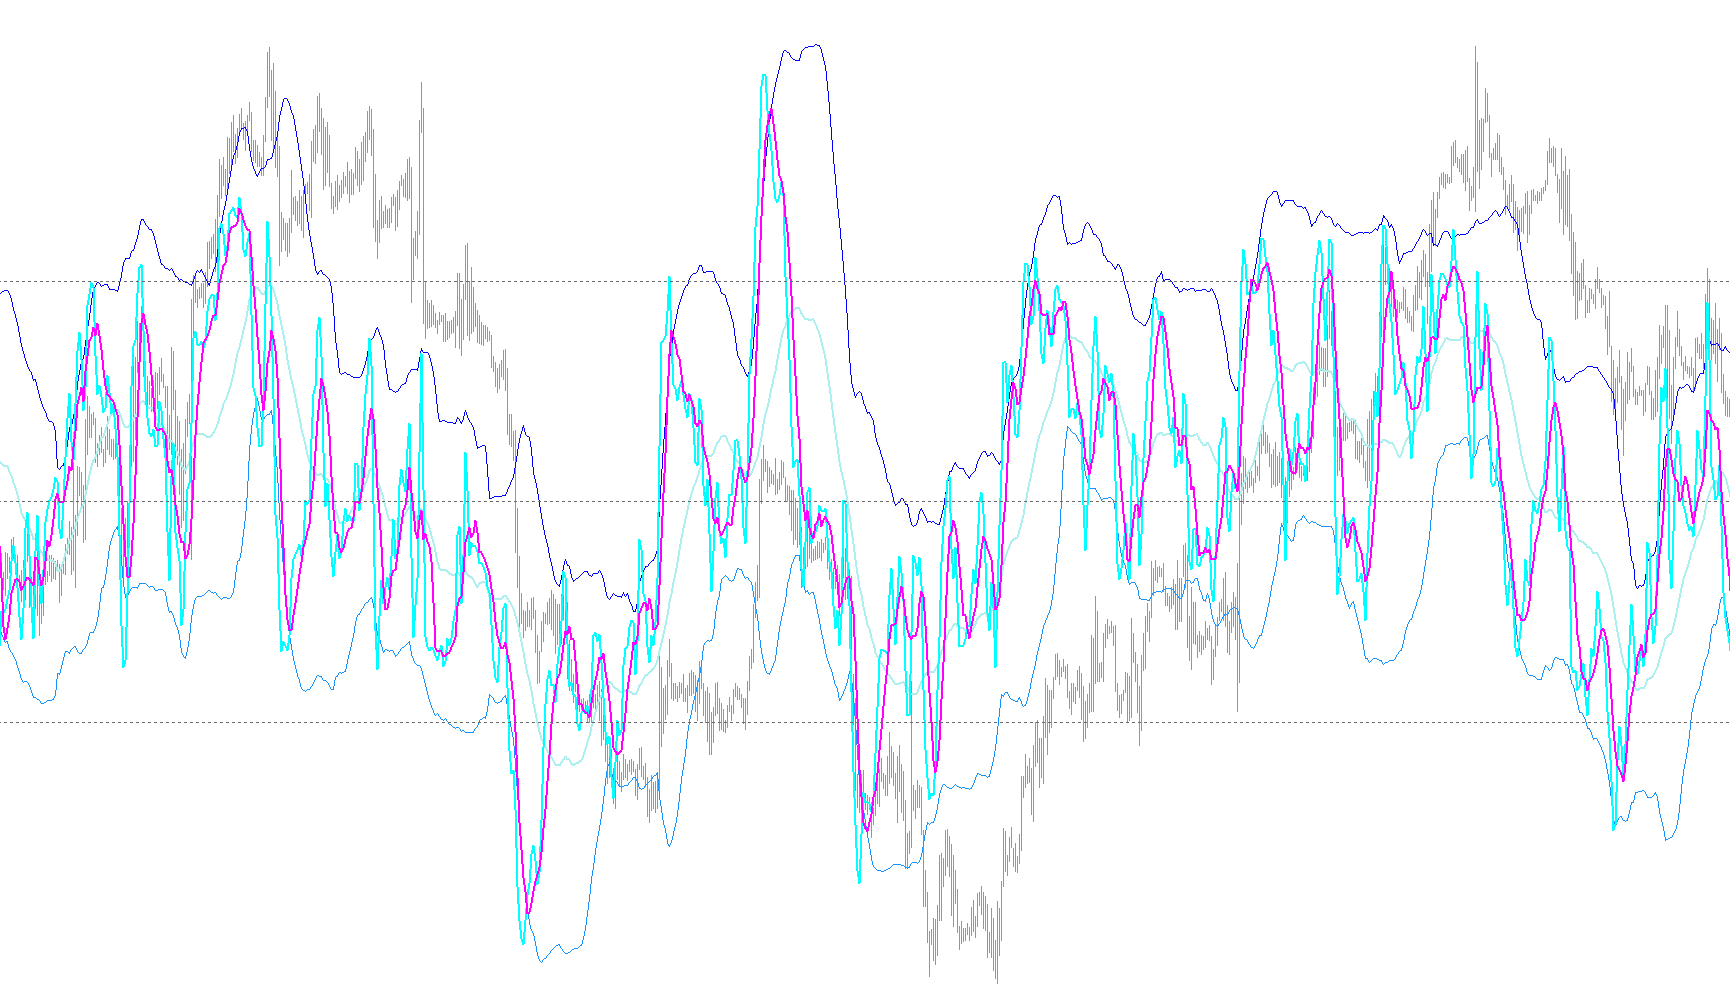
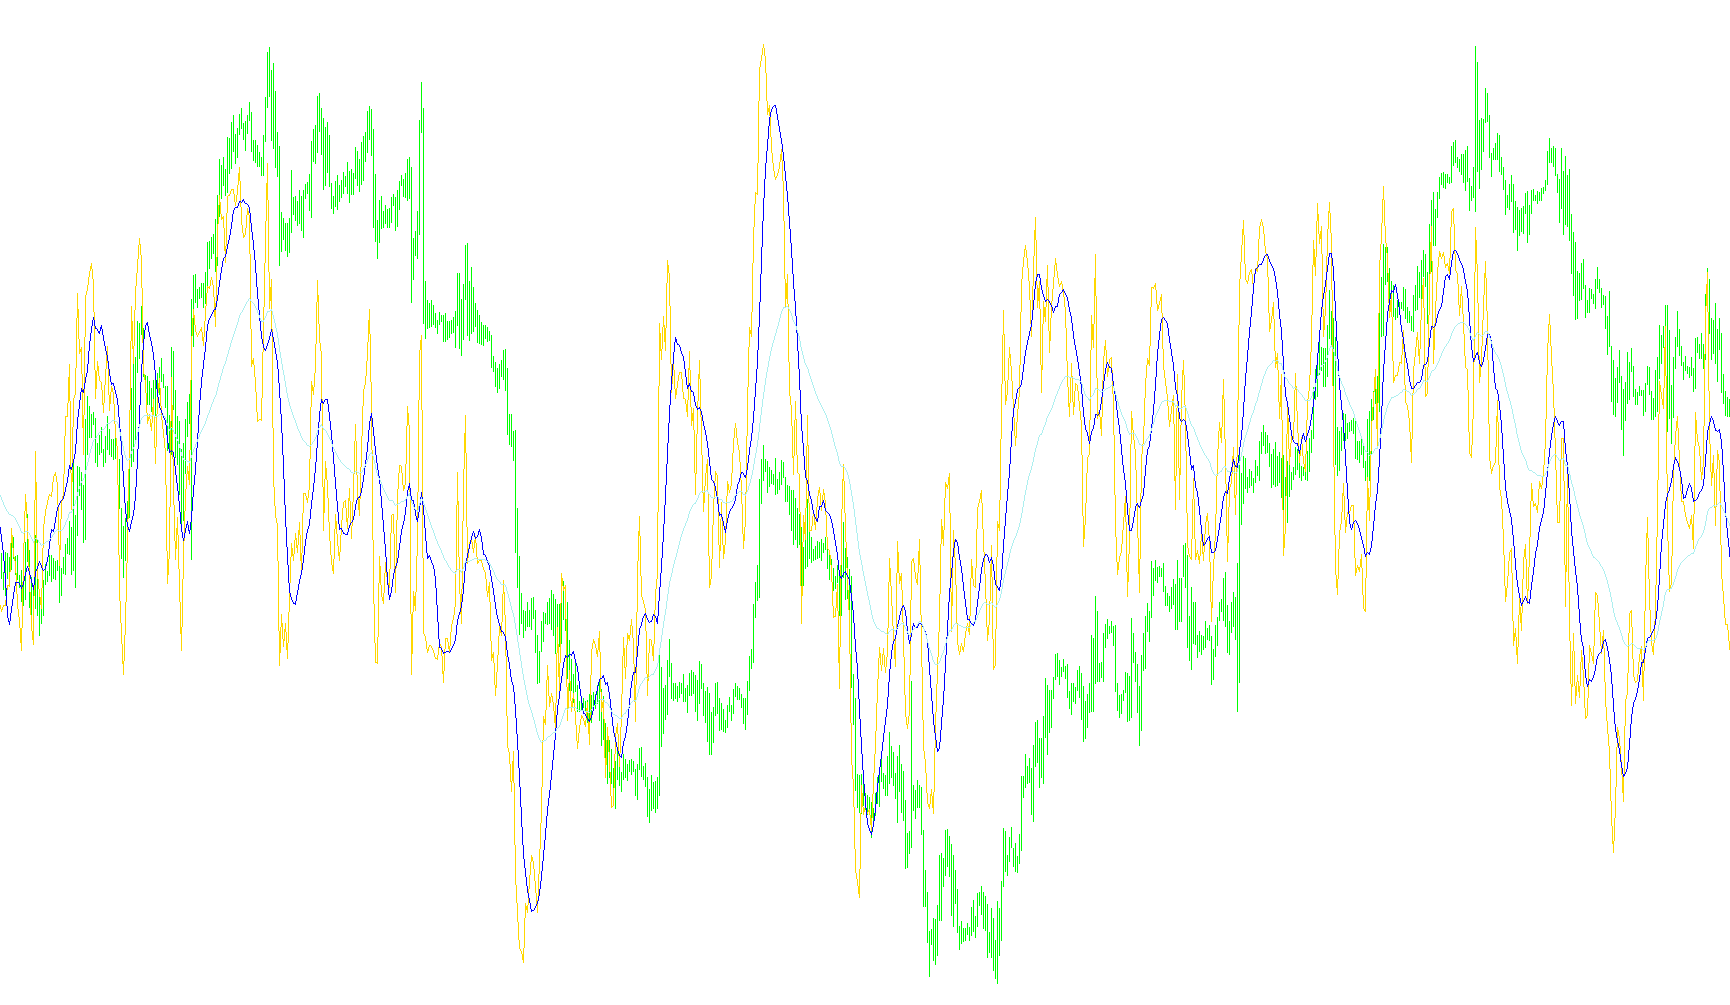
A hybrid technical indicator that synthesizes RSI price action, moving average signal crossovers, and standard deviation bands to identify trend strength, market consolidation, and multi-tiered entry points.

test 5minRSI
Indicator

test 5minRSI

iRSI

The logic identifies sustained price momentum by evaluating if historical RSI values consistently maintain a position above 55 or below 45 to filter out insignificant volatility.

ThreeCombo_v2
Indicator

ThreeCombo_v2

iADXiMAiRSI

This indicator identifies high-probability trend alignment by synchronizing moving average crossovers, RSI momentum thresholds, and ADX directional bias to filter actionable entries.

Indicator

TH_MTF_Bar1.4_alerts

iCCIiMACDiADXiOsMA
TrackTrend_MACD_Color
Indicator

TrackTrend_MACD_Color

iMACDiADXiRSI

This indicator synchronizes and visualizes real-time trend orientation across multiple timeframes by evaluating MACD main and signal line momentum shifts.

Traders Dynamic Index VISUAL ALERTS
Indicator

Traders Dynamic Index VISUAL ALERTS

iMAOnArrayiRSI

This hybrid indicator synchronizes RSI price action with standard deviation bands to identify trend velocity, market strength, and breakout potential through multi-layered signal crossover logic.

Traders Dynamic Index Visual Alerts_v2
Indicator

Traders Dynamic Index Visual Alerts_v2

iMAOnArrayiRSI

This hybrid indicator synthesizes RSI-based price action with dynamic standard deviation bands to simultaneously map trend direction, market strength, and volatility contraction.

Traders_Dynamic_Index
Indicator

Traders_Dynamic_Index

iMAOnArrayiRSI

A multi-layered hybrid indicator that synthesizes RSI momentum, standard deviation-based volatility bands, and moving average crossovers to identify trend strength and structural reversals.

Traders_Dynamic_Index_001
Indicator

Traders_Dynamic_Index_001

iMAOnArrayiRSI

This indicator synthesizes RSI price action, dual moving average crossovers, and Fibonacci-weighted standard deviation bands to provide a multi-layered view of trend trajectory, market velocity, and compression zones.

Indicator

Traders_Dynamic_Index_TDI_With_Alerts_TH

iMAOnArrayiRSI
Traders_Dynamic_Index_v2
Indicator

Traders_Dynamic_Index_v2

iMAOnArrayiRSI

A hybrid technical indicator that synchronizes RSI price action, smoothed signal crossovers, and Fibonacci-based volatility bands to identify trend strength and market expansion.

Traders_Dynamic_Index_Visual_Alerts_sound
Indicator

Traders_Dynamic_Index_Visual_Alerts_sound

iMAOnArrayiRSI

This multi-layered oscillator synthesizes RSI price action with standard deviation bands and moving averages to decode instantaneous momentum, structural trend shifts, and compression-based volatility cycles.

TrendForce
Indicator

TrendForce

iCCIiMACDiADXiMA
TrendForce_3
Indicator

TrendForce_3

iCCIiMACDiADXiMA
TrendRSI_v1
Indicator

TrendRSI_v1

iMAOnArrayiRSI

This indicator identifies trend dynamics by applying dual Simple and Exponential Moving Averages directly onto the Relative Strength Index data stream.

TrendRSI_v1_v1
Indicator

TrendRSI_v1_v1

iMAOnArrayiRSI
Trends_v1
Indicator

Trends_v1

iForceiADXiRSI
Trendy Alert
Indicator

Trendy Alert

iBandsiCCIiADXiMA
Trendy
Indicator

Trendy

iBandsiCCIiADXiMA
Trend_Analysis
Indicator

Trend_Analysis

iCCIiMACDiADXiMA
Trend_Analysis_(v_3.1)
Indicator

Trend_Analysis_(v_3.1)

iBearsPoweriBullsPoweriADXiMA
Indicator

TRSI

iMAOnArrayiRSI
TRSI1
Indicator

TRSI1

iMAOnArrayiRSI

This indicator computes a multi-layered smoothing of the Relative Strength Index by applying nested exponential moving averages followed by a displaced simple moving average to filter out market noise.

TRSI2
Indicator

TRSI2

iMAOnArrayiRSI
TRSI_2
Indicator

TRSI_2

iMAOnArrayiRSI
TRSI_L
Indicator

TRSI_L

iMAOnArrayiRSI

This indicator generates a multi-layered smoothing effect by applying successive 3-period exponential moving averages to an RSI base, finalized with a lagged 5-period simple moving average.

Indicator

TRUE_SCALPER_V11

iMAiRSI
turn_area
Indicator

turn_area

iMAiRSI
turn_area_chart
Indicator

turn_area_chart

iMAiRSI

This indicator visualizes a dynamic trading corridor by projecting RSI-based momentum deviations and upper/lower volatility thresholds onto a smoothed Exponential Moving Average baseline.

Ultra
Indicator

Ultra

iATRiMAiRSI

This indicator synthesizes Fibonacci, Prime, and Standard pivot calculations with RSI momentum tracking and ATR-based volatility scaling to identify structural price levels.

Indicator

Vahrokh-Gann-ICWR v0.1.1 beta5_alert

iRSI
valasssp
Indicator

valasssp

iMACDiMAiRSIiStochastic
vForce_Like_Indy
Indicator

vForce_Like_Indy

iBearsPoweriADXiRSIiStochastic

This indicator identifies high-probability trend reversals by synchronizing bullish and bearish signals across Stochastic, RSI, ADX, MACD, Bull/Bear Power, Rate of Change, and Bollinger Bands.

VininI_RSI_FO
Indicator

VininI_RSI_FO

iMAOnArrayiRSI

This indicator transforms normalized Relative Strength Index values into a hyperbolic tangent momentum signal to identify overextended trend reversals.

VininI_RSI_FO_2m
Indicator

VininI_RSI_FO_2m

iMAOnArrayiRSI
Waddah Attar Def RSI
Indicator

Waddah Attar Def RSI

iMAOnArrayiRSI

This indicator calculates the numerical spread between two distinct Relative Strength Index periods and applies a Simple Moving Average to smooth the resulting momentum variance.

Waddah Attar Reverse RSI
Indicator

Waddah Attar Reverse RSI

iRSI

This indicator calculates the complementary value of the Relative Strength Index to visualize downward momentum shifts and overextended price cooling.

Waddah Attar RSI Level
Indicator

Waddah Attar RSI Level

iRSI
Waddah Attar Super Support Resistance
Indicator

Waddah Attar Super Support Resistance

iRSI

This indicator dynamically projects a comprehensive structural grid by aggregating Fibonacci retracements, Pivot Points, Camarilla levels, and RSI-based price conversions onto historical daily open data.

Waddah_Attar_Def_RSI
Indicator

Waddah_Attar_Def_RSI

iMAOnArrayiRSI

This indicator quantifies price velocity by calculating the spread between two distinct RSI periods and applying a Simple Moving Average to smooth the resulting volatility.

Waddah_Attar_Super_Support_Resistance
Indicator

Waddah_Attar_Super_Support_Resistance

iRSI

This indicator projects a comprehensive structural grid by synthesizing high-frequency price levels with Fibonacci retracements, Pivot Points, Camarilla breakdowns, and RSI-derived zones to identify significant market turning points.

WAJDYSS_RSI_indicator_v1
Indicator

WAJDYSS_RSI_indicator_v1

iRSI
wajdyss_RSI_O_L_H_C_Indicator_V2
Indicator

wajdyss_RSI_O_L_H_C_Indicator_V2

iRSI

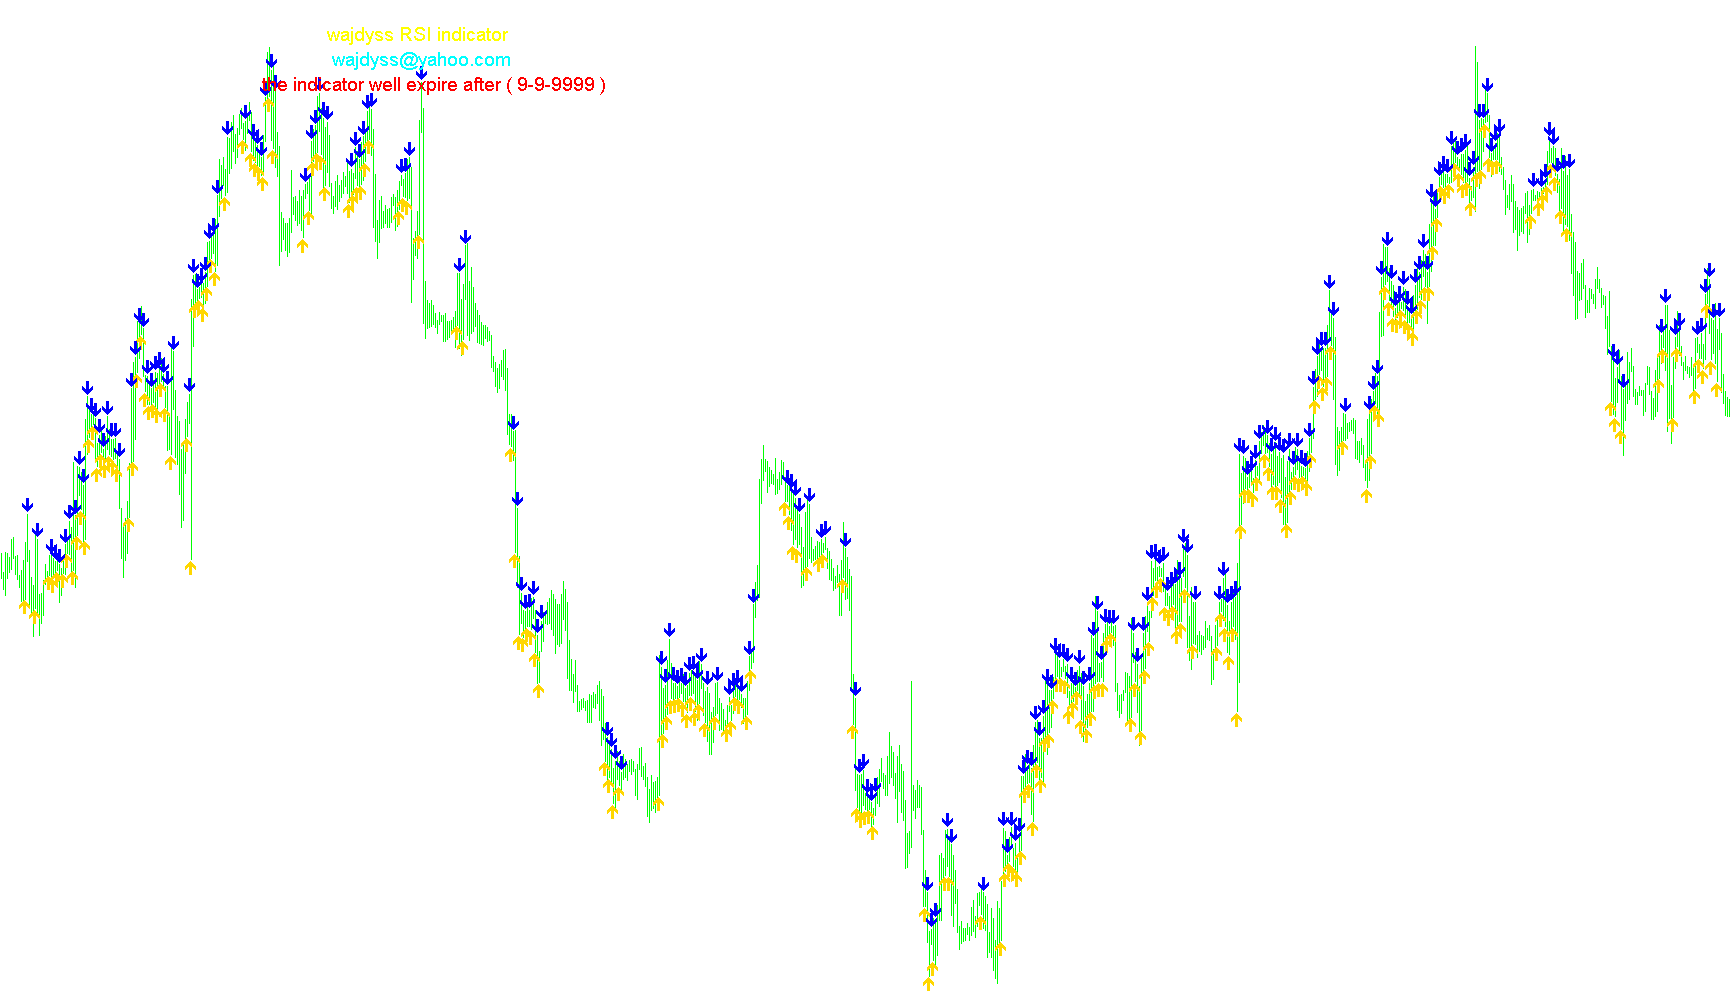
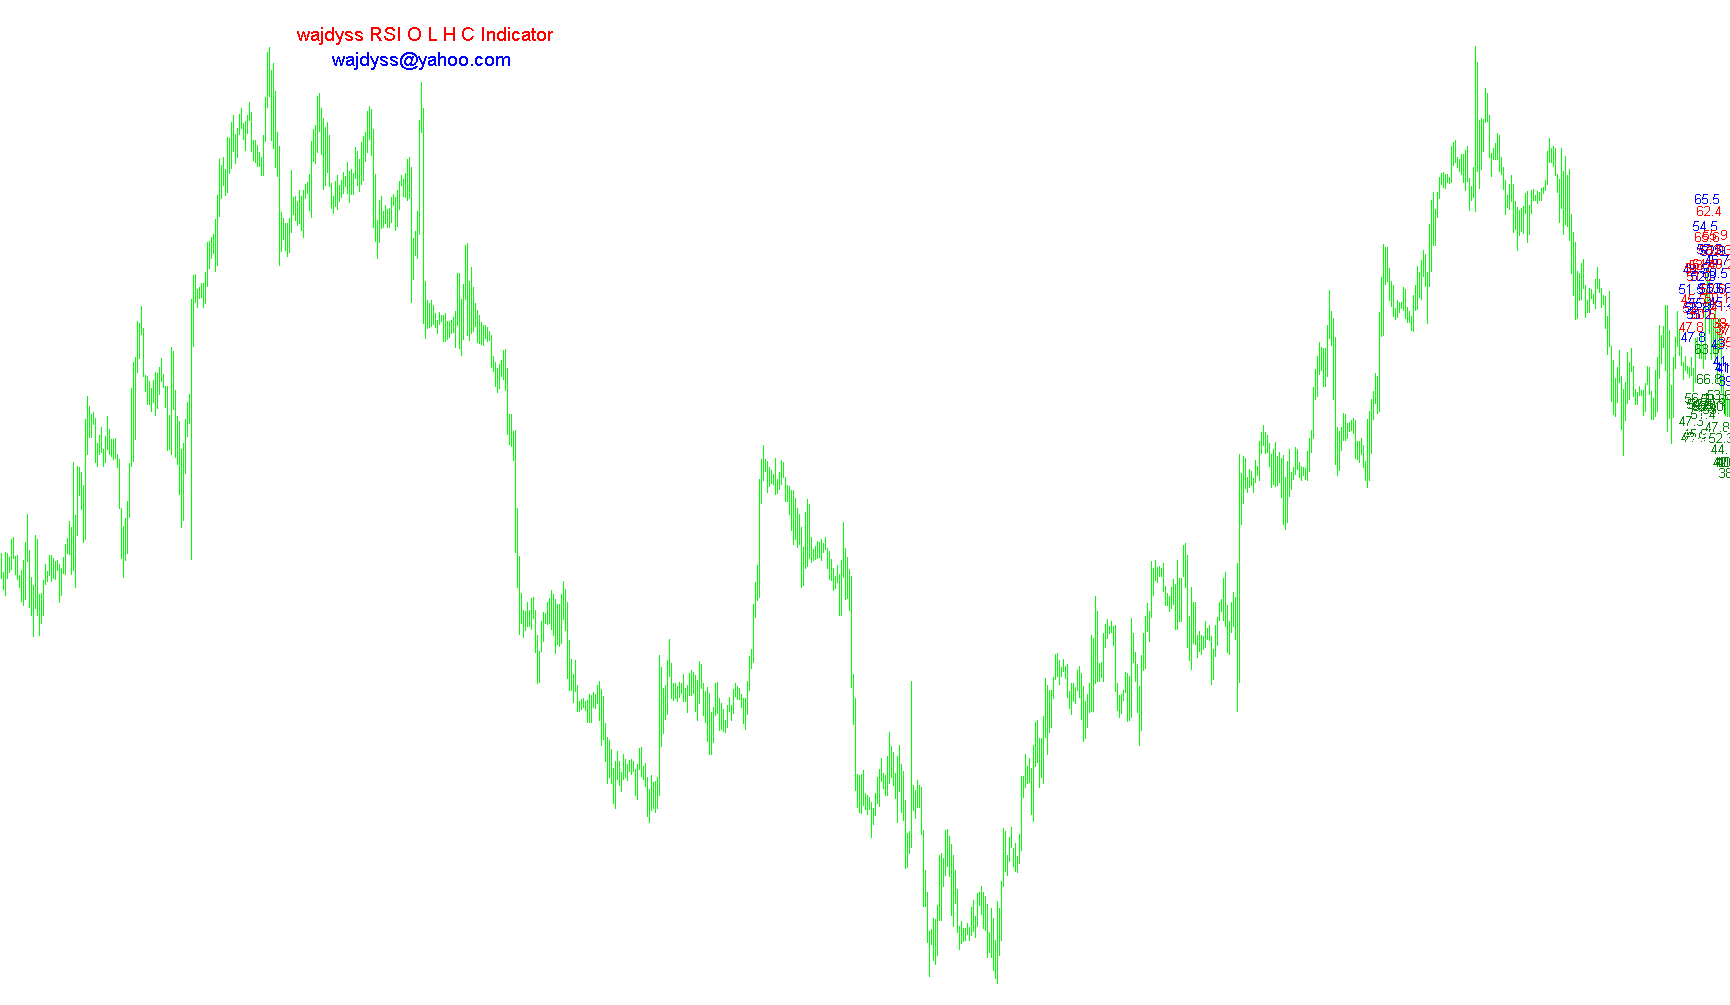
This indicator projects the Relative Strength Index values of Open, High, Low, and Close prices as distinct visual text labels on the price chart to identify momentum distribution.

Wilson Channels
Indicator

Wilson Channels

iDeMarkeriMFIiRSIiStochastic

This indicator maps various momentum oscillators to absolute price coordinates to project potential exhaustion zones and reversal levels directly on the chart.
wma_cross_3emaRSI
Indicator

wma_cross_3emaRSI

iMAiRSI

This indicator identifies bullish and bearish reversals by detecting simultaneous crossovers of multiple moving average periods synchronized with Relative Strength Index threshold breaches.

WPRSI_signal(SoundAlarm)
Indicator

WPRSI_signal(SoundAlarm)

iWPRiRSI
WPRSI_signal
Indicator

WPRSI_signal

iWPRiRSI

This indicator identifies potential trend reversals by detecting simultaneous crossings of the Williams %R extremes combined with RSI momentum filters and historical price action validation.

WPRSI_signal_V.2(SoundAlarm)
Indicator

WPRSI_signal_V.2(SoundAlarm)

iWPRiRSI

This indicator identifies trend reversals and momentum shifts by cross-referencing Williams Percent Range and RSI values with a hyperbolic tangent transformation of cumulative price action.

WPRSI_signal_V.2
Indicator

WPRSI_signal_V.2

iWPRiRSI

This indicator identifies trend reversals and momentum shifts by evaluating the divergence between Williams Percent Range and RSI levels, coupled with a hyperbolic tangent transformation of cumulative price action.

WPR_RSI_cross_alert
Indicator

WPR_RSI_cross_alert

iWPRiRSI

This indicator monitors the convergence and divergence between the Williams Pivot Range and Relative Strength Index to trigger alerts upon their directional intersection.