TRSI_L
Download script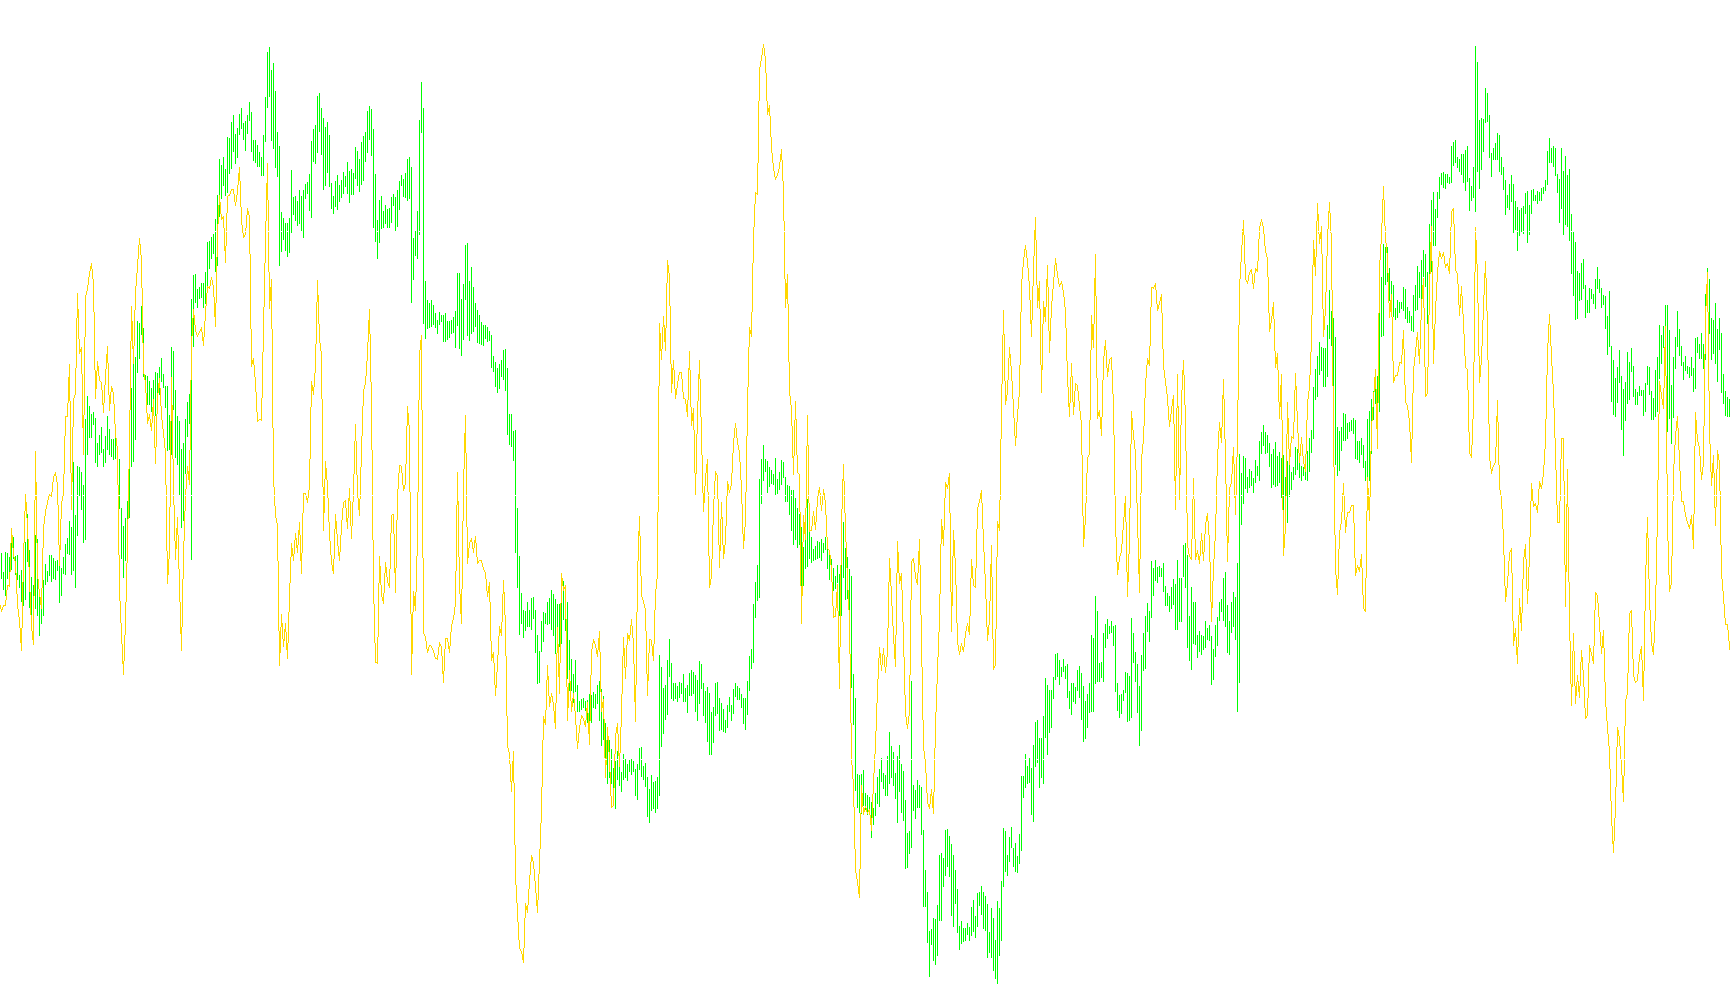
This technical script is designed to provide a multi-layered smoothing of price momentum, helping traders filter out "market noise" to identify clearer trends. Instead of relying on a single raw data point, the logic builds a complex chain of calculations—essentially "smoothing the smooth"—to create a more stable visual signal.
The Logic Flow
The script functions by processing data through five distinct stages:
1. The Base Momentum (RSI) The foundation of the indicator is a standard Relative Strength Index (RSI) calculated over 14 periods. This measures the speed and change of price movements. In this tool, it serves as the raw input for all subsequent calculations.
2. The Triple Smoothing Chain (EMA Layers) To remove erratic spikes from the RSI, the script applies three consecutive layers of Exponential Moving Averages (EMA).
- It takes the first EMA of the RSI.
- It then takes an EMA of that result.
- Finally, it calculates a third EMA based on the previous step.
By layering these three averages, the tool significantly dampens sudden price fluctuations, leaving behind a much more fluid and stable trend line (represented as the blue line).
3. The Final Refinement (SMA & Displacement) To provide an even more stabilized signal, the script takes the final result of the triple smoothing and applies a 5-period Simple Moving Average (SMA). Additionally, this final line is "displaced" or shifted 3 bars to the right. This shift helps in visually separating the primary trend from immediate price action, reducing the likelihood of entering a trade based on a temporary fluctuation.
Visual Summary
When viewing the indicator on a chart, you are seeing the result of this hierarchy:
- Gray Line: The base RSI (Raw Momentum).
- Intermediate Lines: The transitional smoothing steps used to filter the data.
- Blue Line: The result of the triple-layered exponential smoothing.
- Red Line: The final smoothed and shifted output, intended to represent the most stable trend direction.
Summary of Purpose
The core logic here is Successive Smoothing. By taking a momentum oscillator and passing it through multiple mathematical filters (EMA and SMA), the script aims to provide a "cleaner" version of price momentum that ignores minor market jitters in favor of identifying the broader underlying trend.
//+------------------------------------------------------------------+
//|                                                       TRSI       |
//|                                    Copyright © 2007, Robert Hill |
//|                                       http://www.metaquotes.net/ |
//|                                                                  |
//| This is the formula from Mario:
//|
//| 1) RSI 14 period of close. Plot this as the gray line
//|
//| 2) 3-period exponential moving average of #1 above.
//|
//| 3) 3-period exponential moving average of #2 above.
//|
//| 4) 3-period exponential moving average of #3 above.
//|    Plot this as the blue line.
//|
//| 5) 5-period simple moving average of #4 above
//|    displaced 3 bars to the right.
//|    Plot this as the red line.
//|                                                                  |
//+------------------------------------------------------------------+
#property  copyright "Copyright © 2006, Robert Hill "
#property  link      "http://www.metaquotes.net/"

//---- indicator settings
#property  indicator_separate_window
#property  indicator_buffers 5
#property  indicator_color1  Gray
#property  indicator_color2  Aqua
#property  indicator_color3  Red
#property  indicator_color4  Yellow
#property  indicator_color5  White
#property  indicator_width1  1
#property  indicator_width2  1
#property  indicator_width3  1
#property  indicator_width4  1
#property  indicator_width5  1

extern string  r1=" 1. RSI(14) of Close";
extern string  r2=" 2. EMA(3) of #1";
extern string  r3=" 3. EMA(3) of #2";
extern string  r4=" 4. EMA(3) of #3";
extern string  r5=" 5. SMA(5) of #4";
extern string  r6="    shifted right 3 bars";

extern int     RSI_Period = 14;
extern string  p = "--Applied Price Types--";
extern string  p0 = " 0 = close";
extern string  p1 = " 1 = open";
extern string  p2 = " 2 = high";
extern string  p3 = " 3 = low";
extern string  p4 = " 4 = median(high+low)/2";
extern string  p5 = " 5 = typical(high+low+close)/3";
extern string  p6 = " 6 = weighted(high+low+close+close)/4";
extern int     RSI_AppliedPrice = 0;//0=close, 1=open, 2=high, 3=low, 4=median(high+low)/2, 5=typical(high+low+close)/3, 6=weighted(high+low+close+close)/4
extern int     EMA1_Period = 3;
extern int     EMA2_Period = 3;
extern int     EMA3_Period = 3;
extern int     SMA_Period = 5;
extern int     SMA_Shift = 3;
extern bool    PlotEMA1 = true;
extern bool    PlotEMA2 = true;


//---- buffers
double RSI[];
double EmaOfRSI[];
double EmaOfEmaOfRSI[];
double EmaOfEmaOfEmaOfRSI[];
double TRSI[];
double TempEma1RSI[];
double TempEma2RSI[];


//+------------------------------------------------------------------+
//| Custom indicator initialization function                         |
//+------------------------------------------------------------------+
int init()
  {

//---- drawing settings
   IndicatorBuffers(7);
   SetIndexStyle(0,DRAW_LINE);
   SetIndexStyle(1,DRAW_LINE);
   SetIndexStyle(2,DRAW_LINE);
   SetIndexDrawBegin(0,RSI_Period);
   IndicatorDigits(4);

//---- 3 indicator buffers mapping
   if(!SetIndexBuffer(0,RSI) &&
      !SetIndexBuffer(1,EmaOfEmaOfEmaOfRSI) &&
      !SetIndexBuffer(2,TRSI) &&
      !SetIndexBuffer(3,EmaOfRSI) &&
      !SetIndexBuffer(4,EmaOfEmaOfRSI) &&
      !SetIndexBuffer(5,TempEma1RSI) &&
      !SetIndexBuffer(6,TempEma2RSI))
      Print("cannot set indicator buffers!");
//---- name for DataWindow and indicator subwindow label
   SetIndexLabel(0,"RSI");
   SetIndexLabel(1,"TripleEmaOfRSI");
   SetIndexLabel(2,"TRSI");
   SetIndexLabel(3,"EmaOfRSI");
   SetIndexLabel(4,"DoubelEmaOfRSI");
   SetLevelStyle(STYLE_DOT, 1, Gray);
   SetLevelValue(0, 30);
   SetLevelValue(1, 50);
   SetLevelValue(2, 70);

   IndicatorShortName("TRSI("+RSI_Period+")");
//---- initialization done
   return(0);
  }

int start()
{
   int i, limit;
   int    counted_bars=IndicatorCounted();
   if(counted_bars>0) counted_bars--;
//   limit=Bars-counted_bars - RSI_Period;
   limit=Bars-counted_bars;


// 1) RSI 14 period of close. Plot this as the gray line
//   for(i = limit; i >= 0; i--)
   for(i=0; i<limit; i++)
       RSI[i] = iRSI(NULL,0,RSI_Period,RSI_AppliedPrice,i);

// 2) 3-period exponential moving average of #1 above.
//   for(i = limit; i >=0; i--)
   for(i=0; i<limit; i++)
       TempEma1RSI[i] = iMAOnArray(RSI,Bars,EMA1_Period,0,MODE_EMA,i);

// 3) 3-period exponential moving average of #2 above.
//   for(i = limit; i >=0; i--)
   for(i=0; i<limit; i++)
       TempEma2RSI[i] = iMAOnArray(TempEma1RSI,Bars,EMA2_Period,0,MODE_EMA,i);

// 4) 3-period exponential moving average of #3 above.
//   for(i = limit; i >=0; i--)
   for(i=0; i<limit; i++)
       EmaOfEmaOfEmaOfRSI[i] = iMAOnArray(TempEma2RSI,Bars,EMA3_Period,0,MODE_EMA,i);

//========== COLOR CODING ===========================================

// 5) 5-period simple moving average of #4 above
//    displaced 3 bars to the right.
   for(i = limit; i >=0; i--)
   {
       if (PlotEMA1) EmaOfRSI[i] = TempEma1RSI[i]; else EmaOfRSI[i] = EMPTY_VALUE;
       if (PlotEMA2) EmaOfEmaOfRSI[i] = TempEma2RSI[i]; else EmaOfEmaOfRSI[i] = EMPTY_VALUE;
       TRSI[i] = iMAOnArray(EmaOfEmaOfEmaOfRSI,Bars,SMA_Period,SMA_Shift,MODE_SMA,i);
   }


      return(0);
  }
//+------------------------------------------------------------------+
Comments