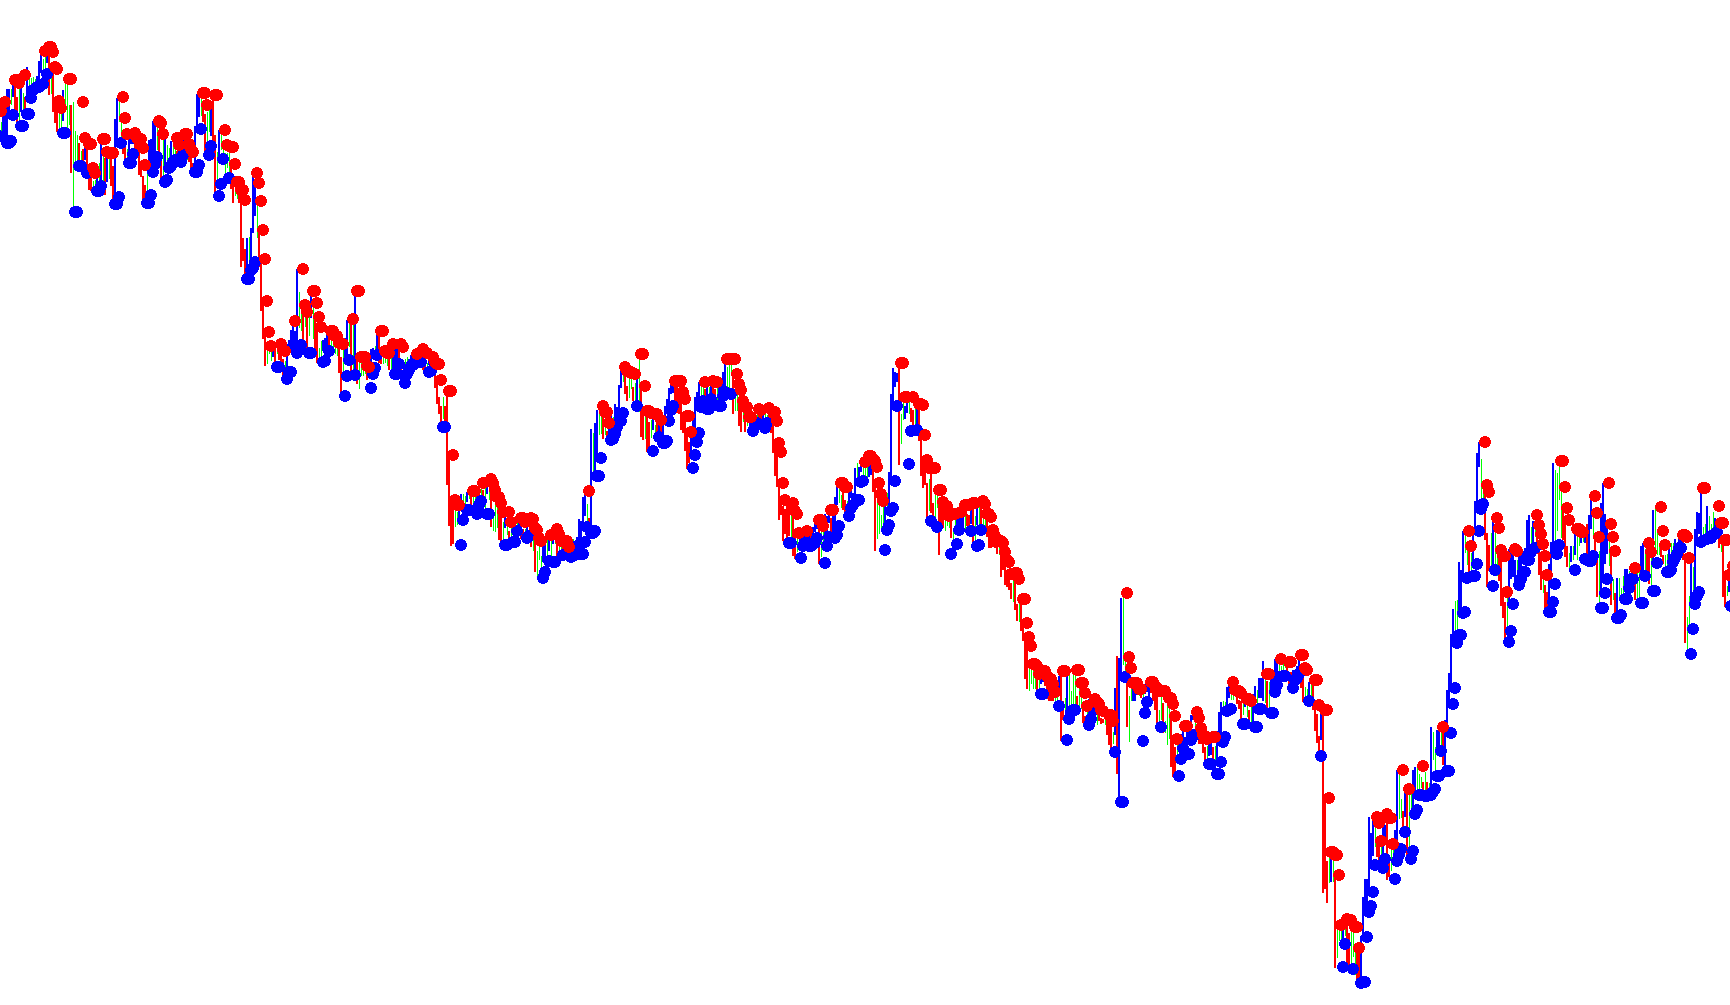
5minYANS_IND_03_v1
Indicator

5minYANS_IND_03_v1

iMAiSAR
Alert_SAR
Indicator

Alert_SAR

iSAR

Triggers a real-time notification when the Parabolic SAR value flips its position relative to the current price open, signaling a potential trend reversal.

alphatrendspotter_free
Indicator

alphatrendspotter_free

iMAiSAR

This indicator synchronizes multi-period EMA crossovers and Parabolic SAR values across daily, weekly, and hourly timeframes to identify high-probability trend alignment.

Brooky_Psar_Levels
Indicator

Brooky_Psar_Levels

iSAR

This indicator identifies structural price ceilings and floors by detecting parabolic SAR directional flips relative to the opening prices of preceding candles.

Indicator

BULLS-BEARS-4XTRAFFIC2

iBearsPoweriBullsPoweriMAiSAR
Indicator

BULLS-BEARS-4XTRAFFIC2_v1

iBearsPoweriBullsPoweriMAiSAR
Indicator

BULLS-BEARS-4XTRAFFIC2_v2

iBearsPoweriBullsPoweriMAiSAR
Indicator

BULLS-BEARS-4XTRAFFIC2_v3

iBearsPoweriBullsPoweriMAiSAR
Darma System Indicator (beta)
Indicator

Darma System Indicator (beta)

iSAR

This indicator identifies trend reversals by detecting specific price action shifts where pivot point extremes align with Parabolic SAR dot transitions.

Darma System Indicator (beta)_v1
Indicator

Darma System Indicator (beta)_v1

iSAR

This system identifies bullish and bearish sentiment shifts by monitoring the transition of polarity dots relative to price extremes and confirming the signal with completed colored histogram bars.

Darma System Indicator (beta)_v2
Indicator

Darma System Indicator (beta)_v2

iSAR

The system identifies reversal opportunities by detecting transitions in dot-based sentiment indicators and confirming them with specific price action bar colorations.

Darma System Indicator (beta)_v3
Indicator

Darma System Indicator (beta)_v3

iSAR

This system identifies trend reversals by monitoring the transition of polarity dots and subsequent bar color shifts to trigger breakout entries.

DashBoard_v1.4_pn
Indicator

DashBoard_v1.4_pn

iACiAOiSAR

This indicator monitors multiple currency pairs and commodities across varied timeframes, generating synchronized buy/sell alerts based on concurrent bullish or bearish crossovers of the Parabolic SAR, Awesome Oscillator, and Awesome Money indicators.

DDFX 5 Fast Trend v3
Indicator

DDFX 5 Fast Trend v3

iSAR
Indicator

Elliott Wave indic

iBearsPoweriBullsPoweriCCIiRSI
Indicator

Elliott Wave indic_v1

iBearsPoweriBullsPoweriCCIiRSI
Fast&Slow&SAR
Indicator

Fast&Slow&SAR

iMAiSAR
Flat Trend
Indicator

Flat Trend

iADXiSAR

This indicator identifies bullish and bearish trend shifts by intersecting Parabolic SAR price levels with directional ADX strength transitions.

Flat Trend_v1
Indicator

Flat Trend_v1

iADXiSAR
FlatTrend SMC modified
Indicator

FlatTrend SMC modified

iADXiMAiSAR

This indicator synthesizes multi-layer moving average stacking, Parabolic SAR price deviations, and ADX directional shifts to identify structural equilibrium and trend exhaustion.

FlatTrend SMC modified_v1
Indicator

FlatTrend SMC modified_v1

iADXiMAiSAR

This indicator identifies market equilibrium by synchronizing multi-period moving average alignment with Parabolic SAR reversals and ADX trend strength divergence.

FlatTrend V2
Indicator

FlatTrend V2

iADXiSAR

This indicator synthesizes Parabolic SAR price positioning with multi-period ADX directional shifts to visualize trend momentum and potential structural reversals.

FlatTrend V21
Indicator

FlatTrend V21

iADXiSAR

This indicator identifies market trend reversals and momentum shifts by correlating Parabolic SAR price crossovers with ADX directional strength dynamics.

FlatTrend V21_v1
Indicator

FlatTrend V21_v1

iADXiSAR

This indicator identifies trend shifts by synthesizing Parabolic SAR price crossovers with ADX momentum velocity gradients across multi-timeframe periods.

FlatTrend V2_v1
Indicator

FlatTrend V2_v1

iADXiSAR

This indicator identifies trend polarity by correlating Parabolic SAR price positioning with the directional divergence of ADX values across multi-timeframe periods.

FlatTrend V2_v2
Indicator

FlatTrend V2_v2

iADXiSAR
FlatTrend V2_v3
Indicator

FlatTrend V2_v3

iADXiSAR
FlatTrend
Indicator

FlatTrend

iADXiSAR

Identifies trend shifts by correlating Parabolic SAR reversals with dual-period ADX momentum fluctuations to detect price breakouts and consolidation states.

FlatTrend1
Indicator

FlatTrend1

iADXiSAR

This indicator identifies bullish and bearish market regimes by filtering Parabolic SAR price crossovers through a minimum ADX threshold of 20 and sequential trend momentum shifts.

FlatTrend1_v1
Indicator

FlatTrend1_v1

iADXiSAR

This indicator synthesizes Parabolic SAR price crossovers with ADX directional strength and trend intensity filters to visualize active market momentum.

FlatTrend_SMC_modified
Indicator

FlatTrend_SMC_modified

iADXiMAiSAR

The logic identifies bearish pressure via Parabolic SAR and ADX divergence while simultaneously validating bullish alignment through multi-period Moving Average stacking.

FlatTrend_SMC_modified_v1
Indicator

FlatTrend_SMC_modified_v1

iADXiMAiSAR
FlatTrend_v1
Indicator

FlatTrend_v1

iADXiSAR
FlatTrend_V2
Indicator

FlatTrend_V2

iADXiSAR

This indicator identifies directional shifts by correlating Parabolic SAR price position with ADX trend strength dynamics to visualize bullish and bearish momentum states.

Flat_Trend
Indicator

Flat_Trend

iADXiSAR

This indicator identifies directional bias by correlating Parabolic SAR price crossovers with ADX trend strength shifts across multi-timeframe analysis.

Indicator

FX Multi-Meter II

iMACDiMAiSARiStochastic
Indicator

FX Multi-Meter

iMACDiMAiSARiStochastic
Indicator

FxOverEasy

iSAR
Indicator

FxOverEasy_v1

iSAR
Indicator

FxOverEasy_v2

iSAR
GG-TrendBar
Indicator

GG-TrendBar

iADXiSAR
i-3SAR-Sig
Indicator

i-3SAR-Sig

iSAR

This indicator identifies momentum shifts by detecting price crossovers on a primary parabolic point combined with synchronized trend confirmations from two secondary historical periods.

Ind-GG01-101
Indicator

Ind-GG01-101

iBandsiMAiSAR

This indicator identifies high-probability entry points by synchronizing Parabolic SAR trend reversals with smoothed moving average crossovers and expanding Bollinger Band volatility expansion.

Ind-GG01
Indicator

Ind-GG01

iBandsiMAiSAR

Identifies high-momentum entries by correlating smoothed moving average crossovers, parabolic SAR price action, and expanding Bollinger Band volatility thresholds.

Ind-GG01M
Indicator

Ind-GG01M

iBandsiMAiSARiStdDev

Identifies trend reversals by synchronizing smoothed moving average crossovers with Parabolic SAR filters and expanding Bollinger Band volatility thresholds.

Ind-GG01M1
Indicator

Ind-GG01M1

iBandsiMAiSARiStdDev
Ind-GG01M_sw
Indicator

Ind-GG01M_sw

iBandsiMAiSARiStdDev

This indicator identifies high-probability reversal points by synchronizing Parabolic SAR trend breaks with expanding Bollinger Band dynamics and smoothed moving average deviations.

JawsTest
Indicator

JawsTest

iSAR

This algorithm identifies high-momentum reversal points by synchronizing Parabolic SAR trend shifts with dynamic Price Channel Stop volatility boundaries.

Indicator

Jaws_v01

iSAR
Jay_Digital Parabolic Spy
Indicator

Jay_Digital Parabolic Spy

iSAR

This indicator synchronizes Parabolic SAR signals and price volatility across four distinct timeframes simultaneously to identify trend reversals and dynamic pip differentials.