JJN-Infobar
Indicator

JJN-Infobar

iMACDiADXiRSIiStochastic

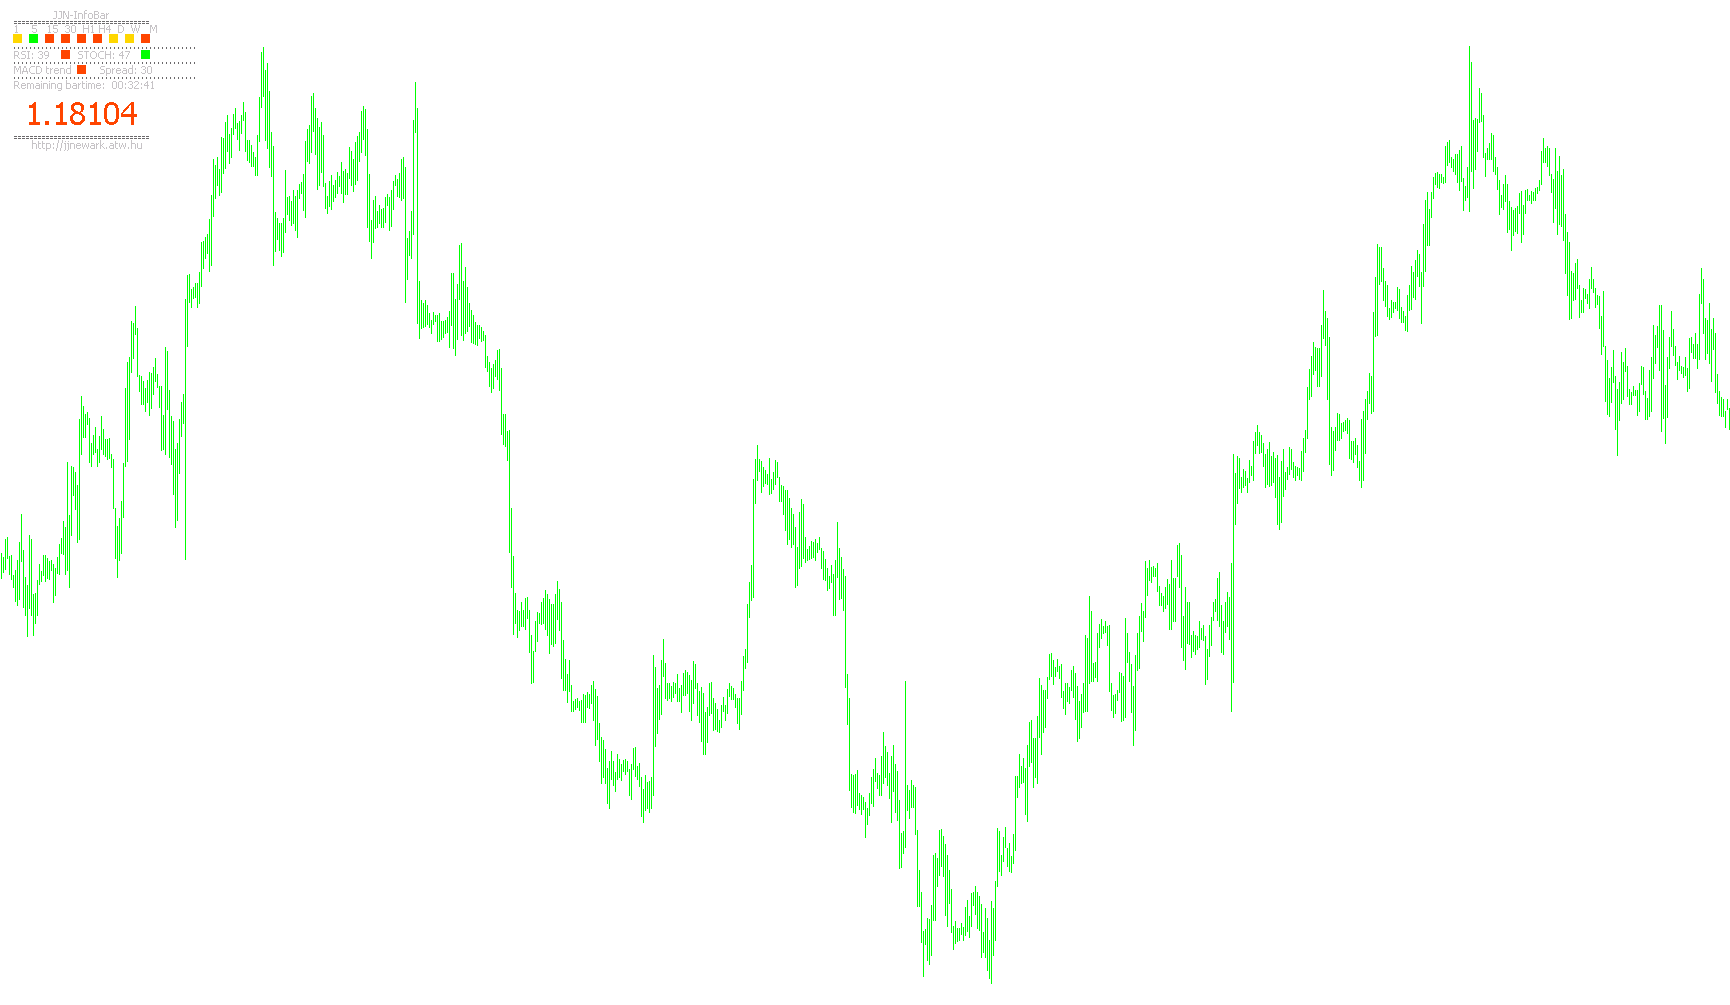
This indicator displays a customizable information panel showing trend direction across multiple timeframes based on ADX and PSAR, along with current RSI, Stochastic, MACD values, spread, remaining bar time, and price.

MAProfit
Indicator

MAProfit

iMAiSARiRSI

This indicator identifies trend reversals by monitoring the interaction between fast and slow moving averages across multiple price points while providing automated backtesting for optimal parameter selection.

MA_monika_SAR
Indicator

MA_monika_SAR

iMAiSAR

This indicator synchronizes Moving Average dynamics and Parabolic SAR reversal signals across four nested temporal horizons to provide a unified view of overarching market momentum.

MA_Support_SAR
Indicator

MA_Support_SAR

iMAiSAR

This indicator plots concurrent Moving Average and Parabolic SAR data across M1, M5, H1, and D1 timeframes on a single M1 chart to identify structural trend alignment.

Nik_PSAR_2B
Indicator

Nik_PSAR_2B

iSAR

This indicator identifies high-probability trend reversals by synchronizing Parabolic SAR signals across multiple nested timeframes to ensure multi-layered momentum alignment.

Nik_PSAR_2B_Guillermo
Indicator

Nik_PSAR_2B_Guillermo

iSAR

This indicator synchronizes Parabolic SAR values across multiple nested timeframes to identify high-probability trend reversals and price crossovers.

OrderGuardian
Indicator

OrderGuardian

iMAiSAR

This EA automates trade management by identifying dynamic profit targets and stop-loss levels based on trendlines, channels, and technical indicators like SAR or Envelopes.

Paires V_5
Indicator

Paires V_5

iBandsiMAiSAR
Parabolic SAR Color - Alert(2)
Indicator

Parabolic SAR Color - Alert(2)

iSAR
Parabolic SAR Color - Alert(2)email
Indicator

Parabolic SAR Color - Alert(2)email

iSAR
Parabolic SAR Color - Alert
Indicator

Parabolic SAR Color - Alert

iSAR
Parabolic SAR Color - Alerts
Indicator

Parabolic SAR Color - Alerts

iSAR

This indicator identifies trend reversals by dynamically switching between dual-colored channels based on the price's interaction with the parabolic SAR calculation.

Parabolic_4cNK
Indicator

Parabolic_4cNK

iSAR
Parabolic_mailalert
Indicator

Parabolic_mailalert

iSAR

This indicator identifies trend reversals by tracking the Parabolic SAR across higher timeframes and visually segregating upward and downward momentum channels.

Parabolic_trendchaser_alert
Indicator

Parabolic_trendchaser_alert

iSAR

This indicator projects Parabolic SAR values from a secondary timeframe onto the current chart to identify overarching trend shifts and directional momentum.

Parabolic_ZZ
Indicator

Parabolic_ZZ

iSAR
Para_B
Indicator

Para_B

iSAR
PipNailer DashBoard_v1.5
Indicator

PipNailer DashBoard_v1.5

iACiAOiSAR

This indicator synchronizes Parabolic SAR, Awesome Oscillator, and Accelerator Oscillator signals across multiple timeframes to identify concurrent trend reversals for various currency pairs and commodities.

PipNailer iSignals_v2
Indicator

PipNailer iSignals_v2

iACiAOiATRiSAR

This indicator identifies high-probability trade entries by detecting simultaneous directional flips across the Parabolic SAR, Awesome Oscillator, and Awesome Chart filters.

PSAR_2B_Line
Indicator

PSAR_2B_Line

iSAR

This indicator identifies potential reversal zones by correlating Parabolic Stop and Reverse levels across current and higher timeframes to filter price action noise.

Indicator

PSAR_2c_MTF_cw

iSAR
Indicator

PSAR_2c_MTF_sw

iSAR
Indicator

PSar_MTF_sw

iSAR
Indicator

pVS

iSAR
Real_Time_MultiIndicator_v1
Indicator

Real_Time_MultiIndicator_v1

iMACDiADXiMAiSAR

This indicator synthesizes real-time trend data from Parabolic SAR, MACD, Moving Average crossovers, and ADX across multiple timeframes into a unified visual matrix.

RosyPipsIndicator
Indicator

RosyPipsIndicator

iSARiStochastic
SAR Color Bar
Indicator

SAR Color Bar

iSAR

This indicator dynamically visualizes market sentiment by bifurcating the Parabolic SAR values into distinct colored histogram bars based on whether they reside above or below the current price high.

SAR Color
Indicator

SAR Color

iSAR

This indicator dynamically bifurcates the Parabolic SAR into distinct directional visual signals by comparing price action against high-point resistance thresholds.

SAR Colour
Indicator

SAR Colour

iSAR

This indicator bifurcates the Parabolic SAR into distinct visual layers, mapping bullish and bearish momentum by comparing calculated values against historical price ceilings.

SAR oscillator
Indicator

SAR oscillator

iSAR

This indicator calculates the real-time distance between current price action and Parabolic SAR values to visualize momentum shifts and trend exhaustion via a dual-histogram visualizer.

Indicator

SARMACD

iMACDiSAR
SARMACD_v2
Indicator

SARMACD_v2

iMACDiSAR

This logic identifies high-probability reversal points by synchronizing the polarity shifts of the MACD histogram with Parabolic SAR trend deviations.

SAR_ADX_sBar_mtf
Indicator

SAR_ADX_sBar_mtf

iADXiSAR

This indicator synthesizes Parabolic Stop and Reverse levels with Average Directional Index dynamics across multiple timeframes to visualize trend polarity and momentum intensity through a unified color-coded sidebar.

sar_AUTO_STOP_REVERS
Indicator

sar_AUTO_STOP_REVERS

iADXiSAR

This indicator identifies trend shifts by signaling potential reversals when ADX strength transitions across the 25-40 corridor relative to its prior momentum.

sar_color
Indicator

sar_color

iSAR
sar_color_001
Indicator

sar_color_001

iSAR

This indicator dynamically visualizes trend reversals by assigning distinct color-coded signals when the Parabolic SAR values breach high or low price boundaries.

sar_color_v2
Indicator

sar_color_v2

iSAR

This indicator monitors price crossovers relative to the Parabolic SAR values to trigger auditory alerts and visual transitions between upward and downward trend channels.

sar_sto_ as_ao_stevejames_alert
Indicator

sar_sto_ as_ao_stevejames_alert

iACiAOiSARiStochastic

This indicator identifies trend reversals by filtering bullish Stochastic crossovers with Parabolic SAR price positions and upward Awesome Oscillator momentum.

Sem SAR+ADX+StDev
Indicator

Sem SAR+ADX+StDev

iADXiSARiStdDev
Sem SAR+ADX
Indicator

Sem SAR+ADX

iADXiSAR

This indicator identifies high and low probability trend reversal points by cross-referencing the Parabolic SAR trajectory with the directional strength of the ADX (+DI/-DI) components.

signalTable candle
Indicator

signalTable candle

iWPRiMAiSAR
signalTable
Indicator

signalTable

iWPRiMAiSAR
Indicator

signalTable_v1

iWPRiMAiSAR
Stabilitit Indikatot BUY_SELL
Indicator

Stabilitit Indikatot BUY_SELL

iSAR
Indicator

Tabelka_kontrolna_PL

iADiACiAlligatoriFractals
Indicator

TH_MTF_Bar1.4_alerts

iCCIiMACDiADXiOsMA
Indicator

Tickwatcher

iAOiADXiSAR
TP_SAR_Colored_Arrows
Indicator

TP_SAR_Colored_Arrows

iSAR

Identifies trend reversals by detecting price crossovers relative to the Parabolic SAR volatility boundary.

Trailing
Indicator

Trailing

iMAiSAR
TrailingWithPartialClose
Indicator

TrailingWithPartialClose

iMAiSAR

An advanced trade management system featuring seven distinct trailing stop architectures including MA-based, Parabolic SAR, and multi-tiered lock-in logic with automated partial position liquidation.