Fast&Slow&SAR
Download script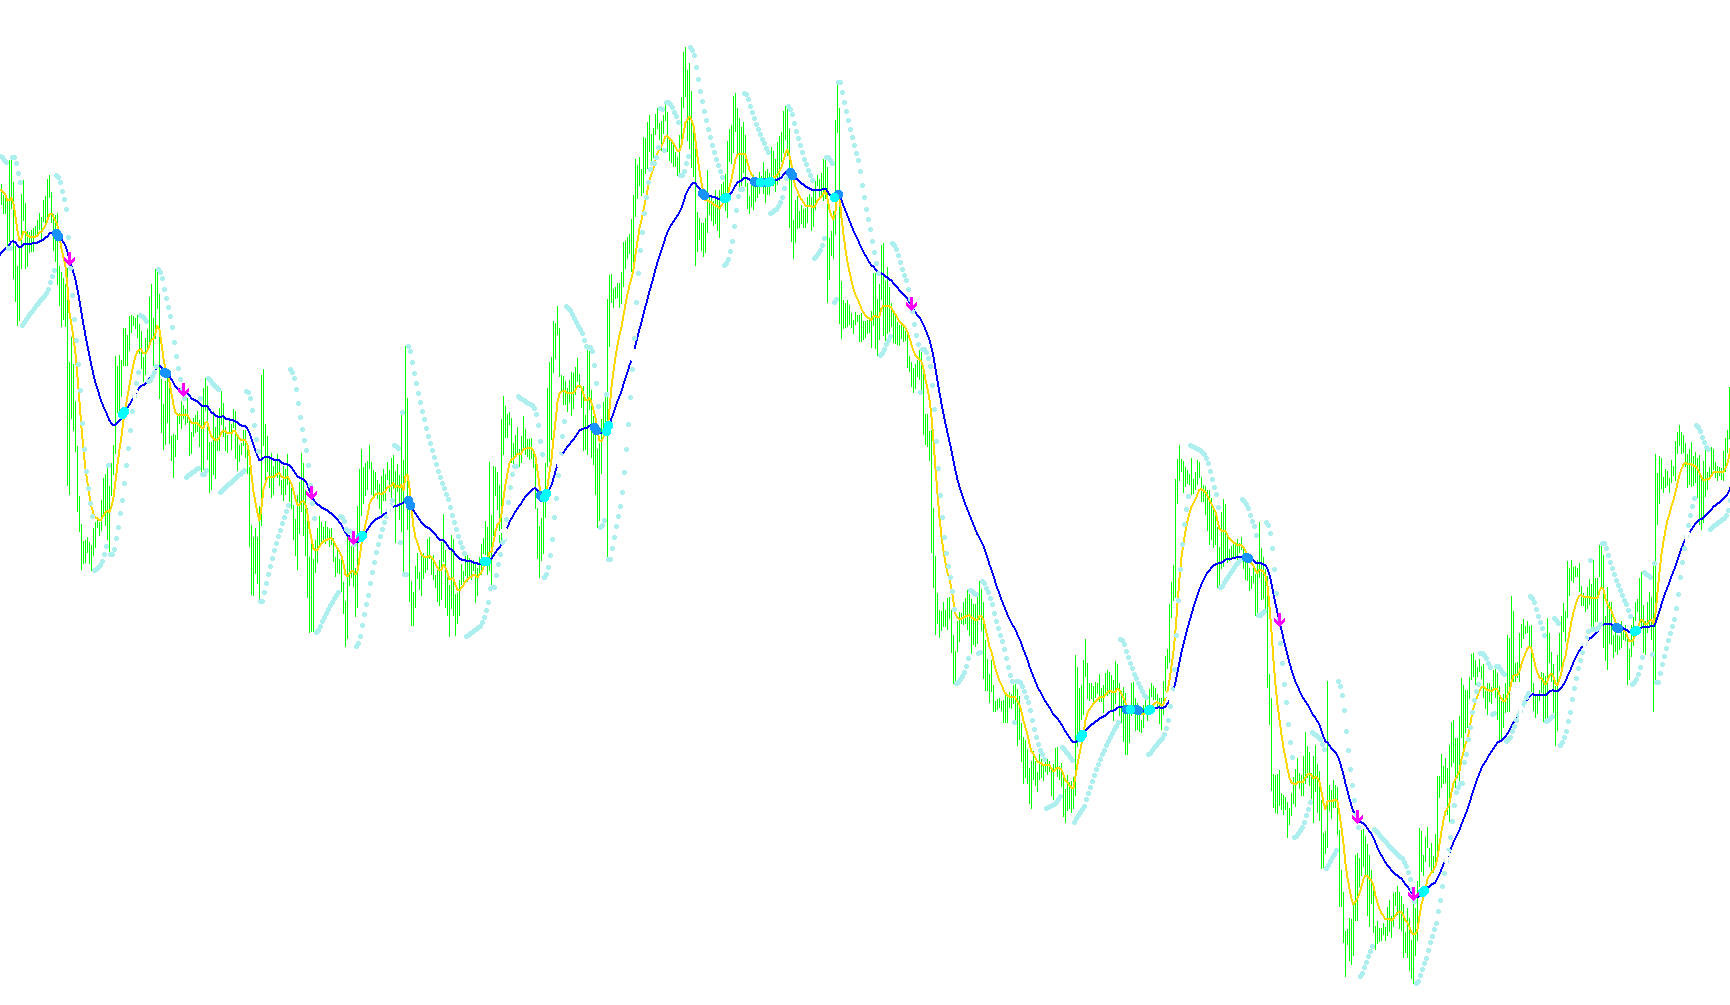
This technical tool is designed to help traders identify potential entry and exit points in the financial markets by combining three distinct types of mathematical analysis into a single visual interface. By layering these different methodologies, the script aims to filter out "market noise" and highlight significant shifts in momentum.
Core Components of the Analysis
The logic operates using three primary technical components:
- Fast & Slow Moving Averages (EMA): These lines track the average price of an asset over two different timeframes (short-term and long-term). The "Fast" line reacts quickly to recent price changes, while the "Slow" line represents the broader trend.
- Parabolic SAR: This is a trailing indicator that identifies potential reversals in price movement. It typically appears as dots that follow the price, helping to determine when a trend might be losing steam or changing direction.
Trading Logic & Signal Generation
The script monitors the interaction between these three components to generate specific visual cues:
1. Trend Crossings (Momentum Shifts) The tool watches for "crosses" between the Fast and Slow Moving Averages.
- When the Fast line moves above the Slow line, it suggests that short-term upward momentum is accelerating, which may indicate a transition to a bullish trend.
- When the Fast line drops below the Slow line, it suggests that short-term downward pressure is increasing, signaling a potential bearish shift.
2. Confirmed Reversals (The "Arrow" Signals) To increase accuracy, the script doesn't just rely on moving average crosses alone. It looks for specific "confluence"—where multiple indicators agree at the same time. The primary signals (shown as arrows) are triggered when:
- Sell Signals: The Parabolic SAR moves from below to above the Moving Averages while simultaneously interacting with both the Fast and Slow lines.
- Buy Signals: The Parabolic SAR moves from above to below the Moving Averages, confirming that price momentum is breaking toward the upside in alignment with the moving averages.
User Experience Features
- Visual Alerts: Instead of just numbers, the script places icons (arrows) directly on your chart to highlight exactly where the logic detects a high-probability trend change.
- Real-Time Monitoring: The tool constantly calculates these values as new price data arrives, updating the "Fast," "Slow," and "Parabolic" values on your screen.
- On-Screen Data: It provides a live text summary in the corner of your chart, showing the exact numerical values for all three indicators, allowing for quick manual verification of the current market state.
In summary, this script acts as an automated analyst that watches the "tug-of-war" between short-term price action and long-term trends, only alerting you when the momentum and the trailing reversal indicators agree on a specific direction.
//+------------------------------------------------------------------+
//|                                                Fast&Slow&SAR.mq4 |
//|                                      Copyright © 2006, BearSerg. |
//|                                        http://bearserg.wallst.ru |
//+------------------------------------------------------------------+
#property copyright "Copyright © 2006, BearSerg."
#property link      "http://bearserg.wallst.ru"

#property indicator_chart_window

#property indicator_buffers 9

#property indicator_color1 Goldenrod
#property indicator_width1 2
#property indicator_color2 SeaGreen
#property indicator_width2 2
#property indicator_color3 Aqua
#property indicator_width3 1
#property indicator_color4 Magenta
#property indicator_width4 2
#property indicator_color5 Chartreuse
#property indicator_width5 2
#property indicator_color6 Magenta
#property indicator_width6 1
#property indicator_color7 Chartreuse
#property indicator_width7 1

//---- input parameters
extern int       Fast=10;
extern int       Slow=40;
//extern int       Stop=50;
//extern int       TakeProfit=100;

//---- indicator buffers
double ExtFastBuffer[];
double ExtSlowBuffer[];
double ExtParabolicBuffer[];
double CrossUp[];
double CrossDown[];
double ArrowUp[];
double ArrowDown[];
bool AlertBuySignal, AttentionBuySignal, AlertSellSignal, AttentionSellSignal;

//+------------------------------------------------------------------+
//| Custom indicator initialization function                         |
//+------------------------------------------------------------------+
int init()
  {
   ObjectsDeleteAll(0, DRAW_ARROW);
//---- indicators
//---- first positions skipped when drawing
   SetIndexDrawBegin(0,Fast);
   SetIndexDrawBegin(1,Slow);
   SetIndexDrawBegin(3,1);
//---- 3 indicator buffers mapping
   SetIndexBuffer(0,ExtFastBuffer);
   SetIndexBuffer(1,ExtSlowBuffer);
   SetIndexBuffer(2,ExtParabolicBuffer);
   SetIndexBuffer(3, CrossUp);
   SetIndexBuffer(4, CrossDown);
   SetIndexBuffer(5, ArrowUp);
   SetIndexBuffer(6, ArrowDown);
//---- drawing settings
   SetIndexStyle(0,DRAW_LINE, STYLE_SOLID, 2);
   SetIndexStyle(1,DRAW_LINE, STYLE_SOLID, 2);
   SetIndexStyle(2,DRAW_ARROW, 2);
   SetIndexStyle(3, DRAW_ARROW, EMPTY);
   SetIndexStyle(4, DRAW_ARROW, EMPTY);
   SetIndexStyle(5, DRAW_ARROW, EMPTY);
   SetIndexStyle(6, DRAW_ARROW, EMPTY);
   SetIndexArrow(2,159);
//---- index labels
   SetIndexLabel(0,"FastEMA(" + Fast + ")");
   SetIndexLabel(1,"SlowEMA(" + Slow + ")");
   SetIndexLabel(2,"Parabolic SAR (0.02, 0.2)");
   SetIndexLabel(3,"Attention for Sell");
   SetIndexLabel(4,"Attention for Buy");
   SetIndexLabel(5,"Buy signal");
   SetIndexLabel(6,"Sell signal");
//---- initialization done
   SetIndexArrow(3, 108);
   SetIndexArrow(4, 108);
   SetIndexArrow(5, 234);
   SetIndexArrow(6, 233);

   return(0);
  }

//+------------------------------------------------------------------+
//| Custom indicator deinitialization function                       |
//+------------------------------------------------------------------+
int deinit()
  {
//----
    ObjectsDeleteAll(0, DRAW_ARROW);
//----
   return(0);
  }
//+------------------------------------------------------------------+
//| Custom indicator iteration function                              |
//+------------------------------------------------------------------+
int start()
  {
   int limit, counter;
   double Range, AvgRange, Shift, r, r1;

  int counted_bars=IndicatorCounted();
//---- check for possible errors
   if(counted_bars<0) return(-1);
//---- last counted bar will be recounted
   if(counted_bars>0) counted_bars--;
   limit=Bars-counted_bars;
//---- main loop
   for(int i=0; i<limit; i++)
     {

         ExtFastBuffer[i]=iMA(NULL,0,Fast,0,MODE_EMA,PRICE_MEDIAN,i);
         ExtSlowBuffer[i]=iMA(NULL,0,Slow,0,MODE_EMA,PRICE_MEDIAN,i);
         ExtParabolicBuffer[i]=iSAR(NULL,0,0.02,0.2,i);

         if ( (ExtFastBuffer[i-2] < ExtSlowBuffer[i-2]) &&
            (ExtFastBuffer[i] > ExtSlowBuffer[i]) && !AttentionSellSignal )
         {
            CrossUp[i-1] = ExtSlowBuffer[i-1];
            AlertSellSignal = false;
            AlertBuySignal = false;
            AttentionSellSignal = false;
            AttentionBuySignal = false;
         }

         if ( (ExtFastBuffer[i-2] > ExtSlowBuffer[i-2]) &&
            (ExtFastBuffer[i] < ExtSlowBuffer[i]) && !AttentionBuySignal )
         {
            CrossDown[i-1] = ExtSlowBuffer[i-1];
            AlertBuySignal = false;
            AlertSellSignal = false;
            AttentionBuySignal = false;
            AttentionSellSignal = false;
         }

         if ( ( (ExtParabolicBuffer[i-1] >= ExtSlowBuffer[i-1]) &&
            (ExtParabolicBuffer[i] <= ExtSlowBuffer[i]) ) &&
            ( (ExtParabolicBuffer[i-1] < ExtFastBuffer[i-1]) &&
            (ExtParabolicBuffer[i] < ExtFastBuffer[i])) )
         {
               ArrowDown[i] = ExtSlowBuffer[i];
               AlertSellSignal = false;
               AlertBuySignal = false;
         }
         if ( ( (ExtParabolicBuffer[i-1] <= ExtSlowBuffer[i-1]) &&
            (ExtParabolicBuffer[i] >= ExtSlowBuffer[i]) ) &&
            ( (ExtParabolicBuffer[i-1] > ExtFastBuffer[i-1]) &&
            (ExtParabolicBuffer[i] > ExtFastBuffer[i]) ) )
         {
            ArrowUp[i] = ExtSlowBuffer[i];
            AlertBuySignal = false;
            AlertSellSignal = false;
         }

         Comment("FastEMA:",ExtFastBuffer[i],"  SlowEMA:",ExtSlowBuffer[i],"  ParabolicSAR:",ExtParabolicBuffer[i]);
     }
//---- done
   return(0);
  }
//+------------------------------------------------------------------+
Comments