GG-TrendBar
Download script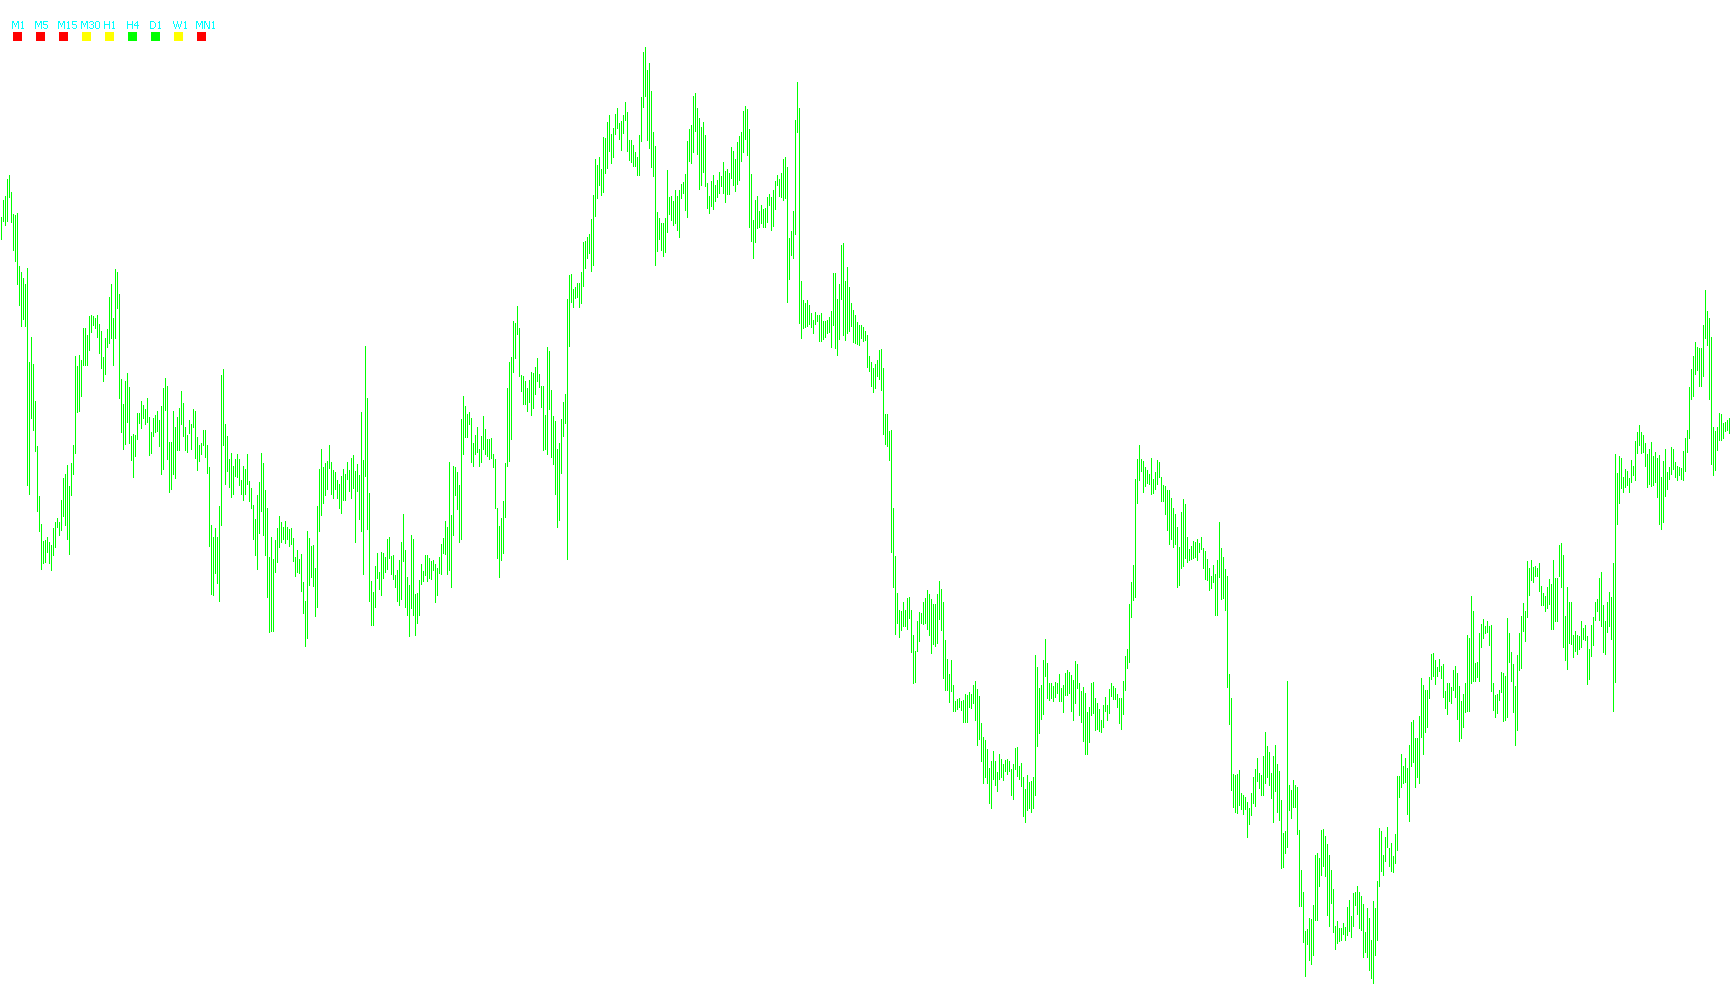
GG-TrendBar Indicator Overview
The GG-TrendBar is a multi-timeframe visual dashboard designed to provide traders with a quick, comprehensive overview of market trends across different periods simultaneously. Instead of forcing you to switch between multiple charts to see what is happening on the 1-minute, hourly, or daily timeframes, this tool aggregates that data into a single, easy-to-read display on your main screen.
How the Logic Works
The indicator functions by analyzing three specific technical components for nine different timeframes (ranging from M1 to Monthly). By combining these elements, the script determines the "health" of the trend for each timeframe and translates that data into a simple color-coded visual signal.
1. The Technical Analysis Components:
- ADX (Average Directional Index): This is used to measure the strength of a trend. The script specifically compares the current strength of the move against its previous state to determine if momentum is gaining or losing steam.
- Parabolic SAR (Stop and Reverse): This is a classic trend-following indicator. The script monitors where the "dots" are positioned relative to the current price. If the dots are below the price, it suggests an upward bias; if they are above, it suggests a downward bias.
2. Decision Making Logic: For every timeframe displayed on your dashboard, the script performs a dual-check:
- Bullish Signal (Upward Trend): If the Parabolic SAR is positioned below the current price AND the ADX shows that momentum is increasing in the positive direction, the indicator identifies a "Buy" or "Up" trend.
- Bearish Signal (Downward Trend): If the Parabolic SAR is positioned above the current price AND the ADX shows that momentum is increasing in the negative direction, the indicator identifies a "Sell" or "Down" trend.
- Neutral Signal (Sideways/Flat): If these conditions are not met (for example, if the market is moving sideways or the indicators are conflicting), the script classifies the trend as neutral.
Visual Representation
To make this information accessible at a glance, the tool uses a color-coded system:
- Lime Green: Indicates an active Bullish trend.
- Red: Indicates an active Bearish trend.
- Yellow: Indicates a neutral or "Flat" market where no clear trend is currently established.
By monitoring these colors across all nine timeframes at once, you can quickly identify "confluence"—moments where multiple timeframes align in the same direction—allowing for better-informed trading decisions.
//+------------------------------------------------------------------+
//|                                                  GG-TrendBar.mq4 |
//|                                                           GGekko |
//|                                                                  |
//+------------------------------------------------------------------+
#property copyright "GGekko"
#property link      ""

#property indicator_chart_window

int tframe[]={1,5,15,30,60,240,1440,10080,43200};
string tf[]={"M1","M5","M15","M30","H1","H4","D1","W1","MN1"};
int tfnumber=9;

extern string ___IndicatorSetup___=">>> Indicator Setup:<<<";
extern int ADX_Period=14;
extern int ADX_Price=PRICE_CLOSE;
extern double Step_Psar=0.02;
extern double Max_Psar=0.2;
extern string ___DisplaySetup___=">>> Display Setup:<<<";
extern color UpColor=Lime;
extern color DownColor=Red;
extern color FlatColor=Yellow;
extern color TextColor=Aqua;
extern int Corner=0;

double Psar;
double PADX,NADX;
string TimeFrameStr;
double IndVal[9];

//+------------------------------------------------------------------+
//| Custom indicator initialization function                         |
//+------------------------------------------------------------------+
int init()
  {

   for(int w=1;w<tfnumber+1;w++)
      {
         ObjectCreate(tf[w-1],OBJ_LABEL,0,0,0,0,0);
         ObjectSet(tf[w-1],OBJPROP_CORNER,Corner);
         ObjectSet(tf[w-1],OBJPROP_XDISTANCE,(w-1)*23+15);
         ObjectSet(tf[w-1],OBJPROP_YDISTANCE,20);
         ObjectSetText(tf[w-1],tf[w-1],8,"Tahoma",TextColor);
      }


//----
   return(0);
  }
//+------------------------------------------------------------------+
//| Custom indicator deinitialization function                       |
//+------------------------------------------------------------------+
int deinit()
  {
//----

   for(int k=1;k<tfnumber+1;k++)
      ObjectDelete("Ind"+k);
   for(k=1;k<tfnumber+1;k++)
      ObjectDelete(tf[k-1]);

//----
   return(0);
  }
//+------------------------------------------------------------------+
//| Custom indicator iteration function                              |
//+------------------------------------------------------------------+
int start()
  {

//----

   for(int a=1;a<tfnumber+1;a++)
      ObjectDelete("Ind"+a);


   for(int j=1;j<tfnumber+1;j++)
      {
         ObjectCreate("Ind"+j,OBJ_LABEL,0,0,0,0,0);
         ObjectSet("Ind"+j,OBJPROP_CORNER,Corner);
         ObjectSet("Ind"+j,OBJPROP_XDISTANCE,(j-1)*23+15);
         ObjectSet("Ind"+j,OBJPROP_YDISTANCE,30);
         ObjectSetText("Ind"+j,CharToStr(110),12,"Wingdings",White);
      }


   for(int x=1;x<tfnumber+1;x++)
      {

      PADX=iADX(NULL,tframe[x-1],ADX_Period ,ADX_Price,1,0);
      NADX=iADX(NULL,tframe[x-1],ADX_Period ,ADX_Price,2,0);
      Psar=iSAR(NULL,tframe[x-1],Step_Psar,Max_Psar,0) ;
        if (Psar < iClose(NULL,tframe[x-1],0) && PADX > NADX)
        {
        IndVal[x-1]=1;
        }
        else if (Psar > iClose(NULL,tframe[x-1],0) && NADX > PADX)
        {
        IndVal[x-1]=-1;
        }
        else IndVal[x-1]=0;
      }


      for(int y=1;y<tfnumber+1;y++)
      {
         if(IndVal[y-1]==-1) ObjectSetText("Ind"+y,CharToStr(110),12,"Wingdings",DownColor);
         if(IndVal[y-1]==0) ObjectSetText("Ind"+y,CharToStr(110),12,"Wingdings",FlatColor);
         if(IndVal[y-1]==1) ObjectSetText("Ind"+y,CharToStr(110),12,"Wingdings",UpColor);
      }


//----
   return(0);
  }
//+------------------------------------------------------------------+
Comments