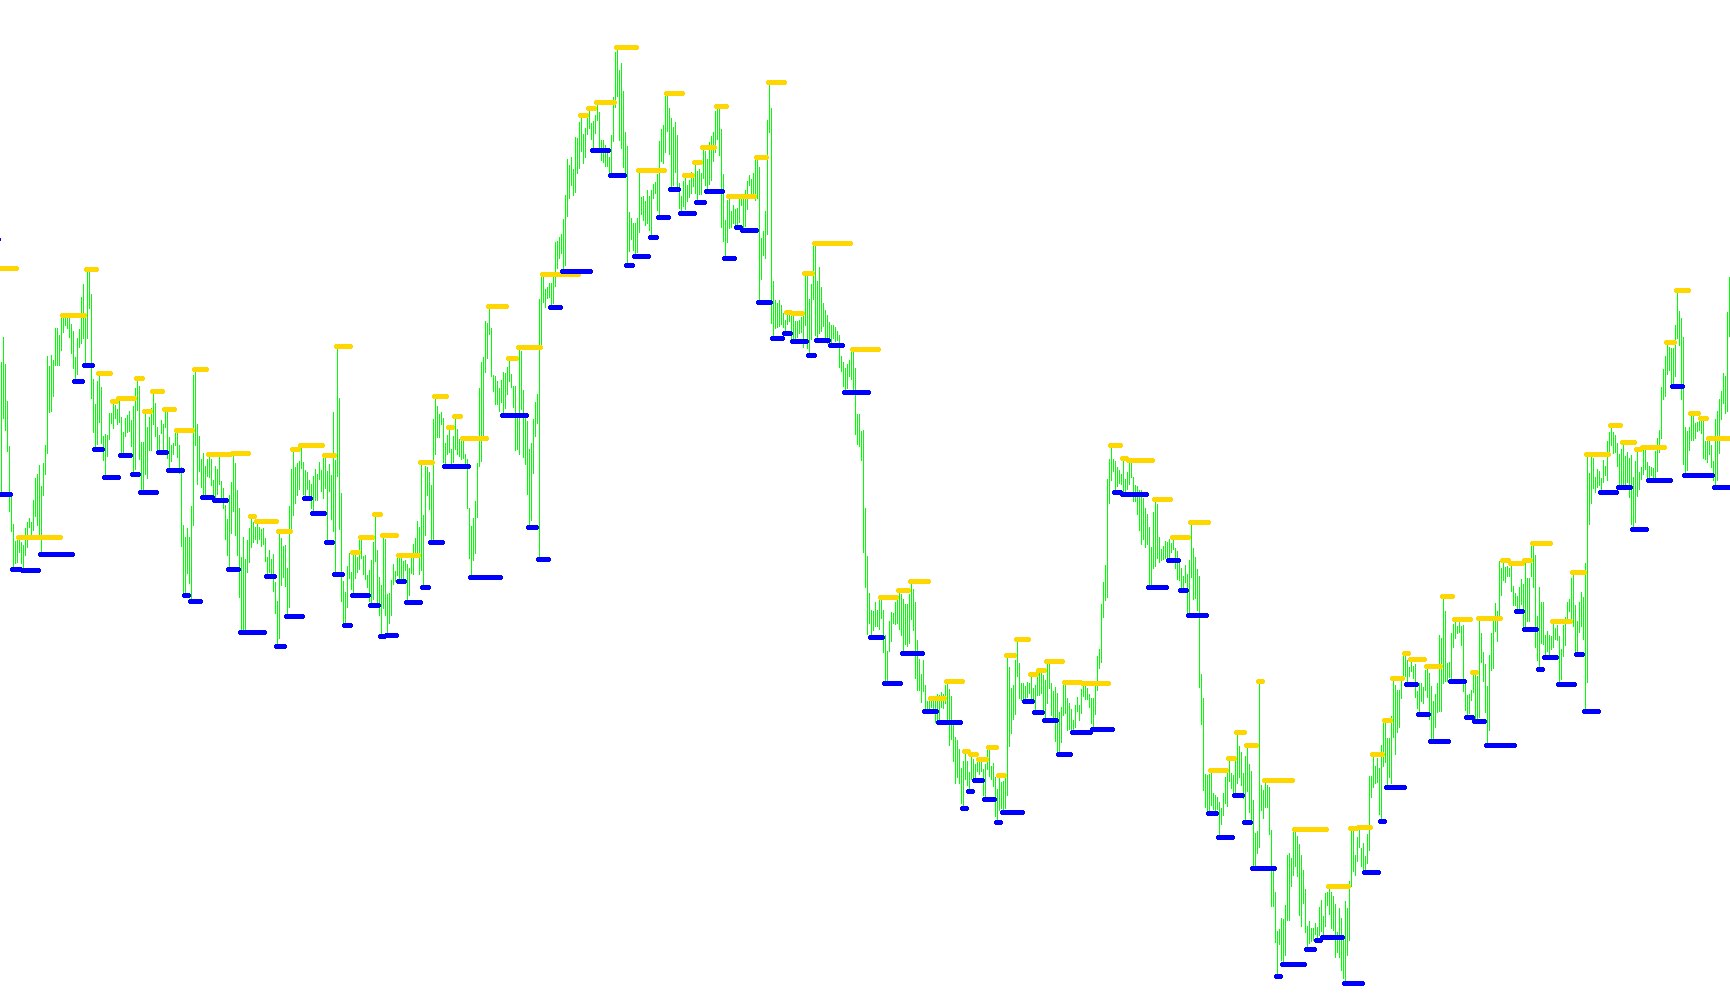
This technical indicator is designed to help traders identify significant turning points in market price action by highlighting specific "Fractal" patterns on a trading chart. In simple terms, it acts as a visual aid to spot peaks and valleys where the price may be reaching a temporary limit or reversing its direction.
How the Logic Works:
- Multi-Timeframe Analysis: The tool is unique because it doesn't just look at the current timeframe you are viewing. It is programmed to reference a wider range of timeframes (from 1-minute charts up to monthly charts). This allows the indicator to identify significant price movements that might be "hidden" on smaller, more cluttered charts.
- Dynamic Period Selection: Through a user-defined parameter, the script selects which specific timeframe's data it should prioritize for these fractal calculations. By looking at a higher timeframe, it helps filter out market "noise," ensuring that the signals shown are based on substantial structural changes rather than minor fluctuations.
- Fractal Identification: The logic scans the historical price data to find two specific types of points:
- Upper Fractals: These represent local "peaks" where the price reached a high point relative to the surrounding candles.
- Lower Fractals: These represent local "valleys" where the price hit a low point.
- Visual Representation: Once these peaks and valleys are identified based on the selected timeframe, the script places visual markers (arrows) directly on your chart. These markers highlight where resistance or support levels have formed.
- Data Continuity: The script includes a calculation step to ensure that if a fractal point isn't detected on a specific bar, it carries over the previous data point. This ensures a consistent visual flow of information across the chart history.
In summary, this script functions as an automated "scout" that looks at higher-level market trends to place markers on your current chart, helping you see where major price reversals are likely occurring.
Indicators Used
Miscellaneous
19
Views
0
Downloads
0
Favorites
iFractals2
//+------------------------------------------------------------------+
//|                                                    iFractals.mq4 |
//|                              Copyright © 2006, SOK.LiteForEx.Net |
//|                                         http://sok.liteforex.net |
//+------------------------------------------------------------------+
#property copyright "Copyright © 2006, SOK.LiteForEx.Net"
#property link      "http://sok.liteforex.net"

#property indicator_chart_window
#property indicator_buffers 2
#property indicator_color1 Red
#property indicator_color2 Blue
//---- input parameters
extern int ExtParam1 = 0;
//---- buffers
double ExtMapBuffer1[];
double ExtMapBuffer2[];
//+------------------------------------------------------------------+
//| Custom indicator initialization function                         |
//+------------------------------------------------------------------+
int init()
  {
//---- indicators
   SetIndexStyle(0, DRAW_ARROW, 0, 1);
   SetIndexArrow(0, 159);
   SetIndexBuffer(0, ExtMapBuffer1);
   SetIndexEmptyValue(0, 0.0);
   SetIndexStyle(1, DRAW_ARROW, 0, 1);
   SetIndexArrow(1, 159);
   SetIndexBuffer(1, ExtMapBuffer2);
   SetIndexEmptyValue(1, 0.0);
//----
   return(0);
  }
//+------------------------------------------------------------------+
//| Custom indicator deinitialization function                       |
//+------------------------------------------------------------------+
int deinit()
  {
//----

//----
   return(0);
  }
//+------------------------------------------------------------------+
//| Custom indicator iteration function                              |
//+------------------------------------------------------------------+
int start()
  {
   int counted_bars = IndicatorCounted();
//----
   int periods[] = {0, PERIOD_M1, PERIOD_M5, PERIOD_M15, PERIOD_M30, PERIOD_H1,
                    PERIOD_H4, PERIOD_D1, PERIOD_W1, PERIOD_MN1};
   int period0 = periods[ArrayBsearch(periods, Period()) + ExtParam1];
   int limit;
//---- ïîñëåäíèé ïîñ÷èòàííûé áàð áóäåò ïåðåñ÷èòàí
   if(counted_bars > 0)
       counted_bars--;
   limit = Bars - counted_bars;
//---- îñíîâíîé öèêë
   for(int i = limit; i > 0; i--)
     {
        //---- ma_shift ïðèñâàèâàåòñÿ 0, ïîòîìó ÷òî SetIndexShift, âûçûâàåìûé âûøå
        int BS = iBarShift(NULL, period0, iTime(NULL, 0, i), true);
        ExtMapBuffer1[i] = iFractals(NULL, period0, MODE_UPPER, BS);
        if(ExtMapBuffer1[i] == 0)
          {
            ExtMapBuffer1[i] = ExtMapBuffer1[i+1];
          }
        ExtMapBuffer2[i] = iFractals(NULL, period0, MODE_LOWER, BS);
        if(ExtMapBuffer2[i] == 0)
          {
            ExtMapBuffer2[i] = ExtMapBuffer2[i+1];
          }
     }
//----
   return(0);
  }
//+------------------------------------------------------------------+
Comments