goldminer1
Download script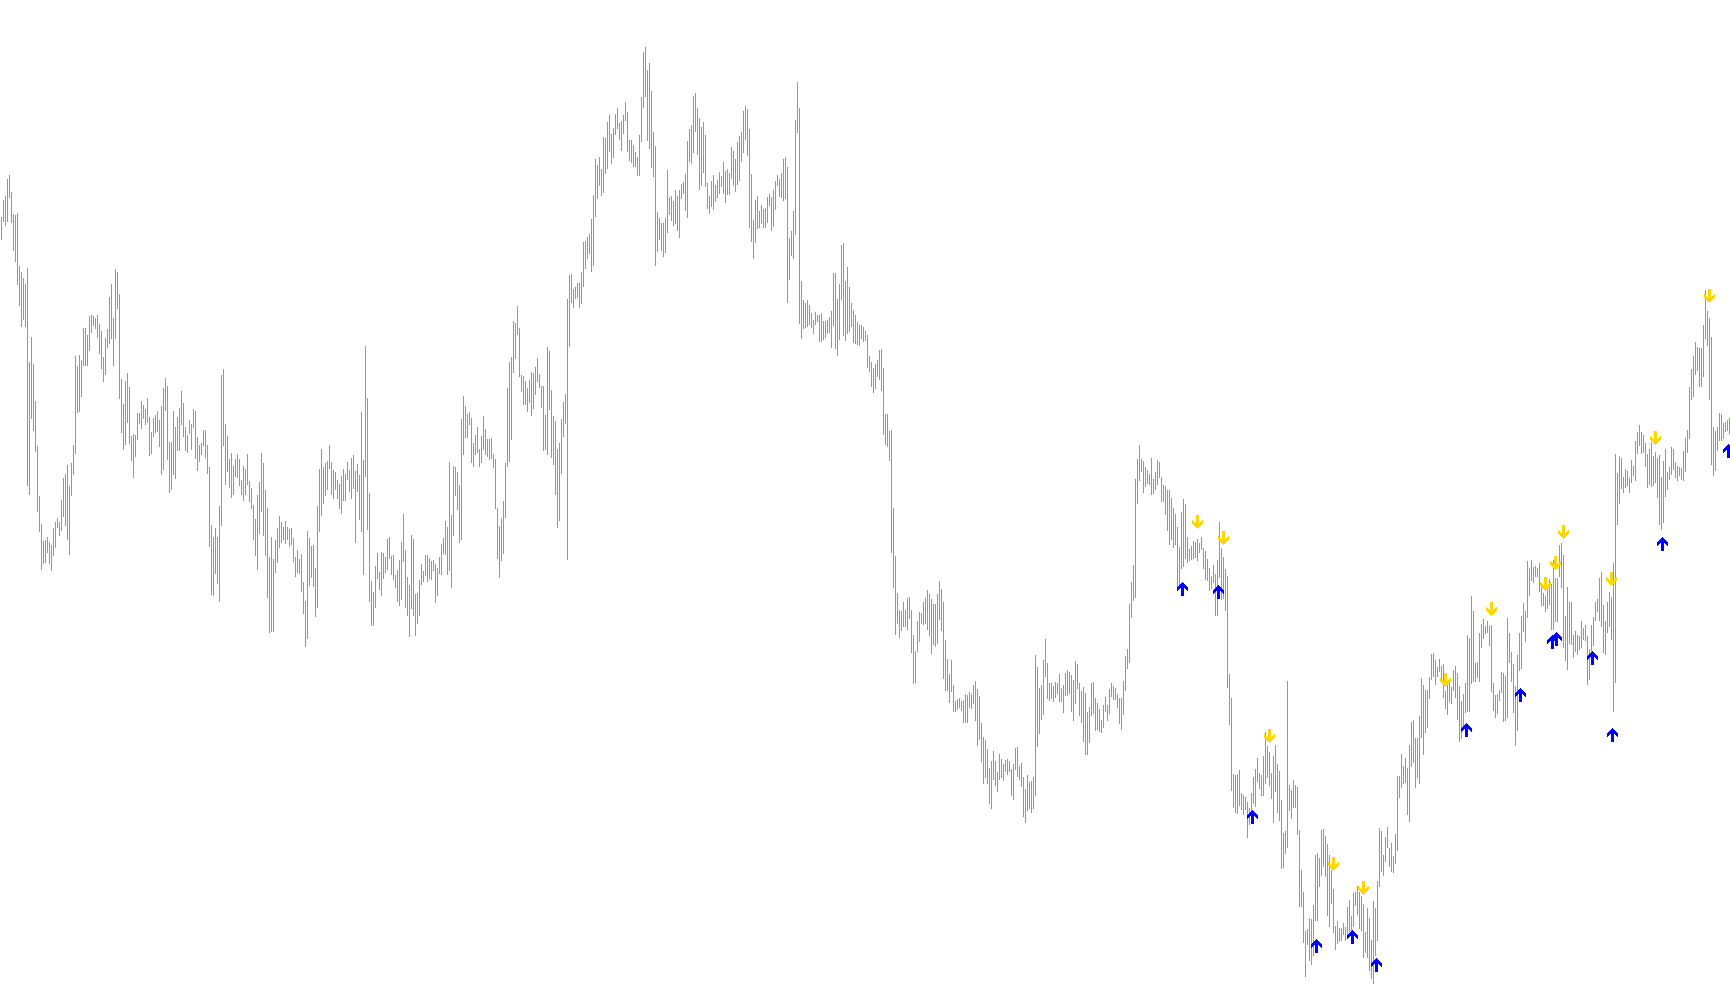
This script functions as a specialized technical analysis tool designed to identify specific price action patterns and momentum shifts in the market. Rather than simply following standard trends, it analyzes the relationship between volatility, price gaps, and relative strength to pinpoint potential entry or exit points.
Core Logic Overview
The indicator operates by scanning recent historical data (up to 300 bars) to evaluate three primary conditions: Volatility, Price Movement, and Relative Strength.
1. Volatility Assessment The script begins by measuring the "average range" of price movement over a 10-bar window. It calculates the distance between the highest and lowest prices in that period. This serves as a baseline to determine what constitutes a "significant" move versus normal market noise.
2. Price Gap & Momentum Detection The logic then looks for two specific types of anomalies:
- Sudden Gaps: It checks if a candle has opened significantly further away from the previous close than the average volatility allows (specifically, a jump of at least twice the average range).
- Significant Swings: It monitors for rapid price transitions over a 6-bar period to see if the market is moving with enough velocity to be considered a meaningful trend shift.
Based on these findings, the script dynamically adjusts its sensitivity. If it detects high-intensity movement, it "shortens" its observation period to react more quickly; otherwise, it maintains a wider, more stable observation window based on user-defined risk settings.
3. Relative Strength and Signal Triggering Finally, the script uses a Relative Strength Index (WPR) to determine where the price sits in relation to its recent highs and lows. It looks for "overextended" conditions:
- Buy Signals: When the relative strength falls below a specific threshold (indicating a potential oversold state) and then begins to bounce back into a predefined range, it places a fuchsia arrow on the chart.
- Sell Signals: When the relative strength rises above a high threshold (indicating a potential overbought state) and starts to pull back, it places a yellow arrow.
Summary of Visual Output
The tool simplifies complex math into two clear visual cues:
- Fuchsia Arrows: Indicate areas where the price has dropped significantly but is showing signs of recovery or stabilization.
- Yellow Arrows: Indicate areas where the price has rallied significantly and may be reaching a point of exhaustion.
//+------------------------------------------------------------------+
//|                                                   goldminer1.mq4 |
//|                                                                  |
//|                                                                  |
//+------------------------------------------------------------------+

#property copyright "Copyright ForexFunnel"
#property link      ""

#property indicator_chart_window
#property indicator_buffers 2
#property indicator_color1 Fuchsia
#property indicator_color2 Yellow


bool gi_unused_132 = FALSE;
extern int RISK = 3;
extern int CountBars = 300;
double g_ibuf_144[];
double g_ibuf_148[];

int init() {
   IndicatorBuffers(2);
   SetIndexStyle(0, DRAW_ARROW);
   SetIndexArrow(0, 234);
   SetIndexStyle(1, DRAW_ARROW);
   SetIndexArrow(1, 233);
   SetIndexBuffer(0, g_ibuf_144);
   SetIndexBuffer(1, g_ibuf_148);
   Comment("goldminer");
   return (0);
}

int start() {
   int li_12;
   double ld_52;
   double ld_60;
   double ld_68;
   double ld_76;
   double ld_84;
   double ld_92;
   double ld_100;
   double lda_108[50000];
   SetIndexDrawBegin(0, Bars - CountBars + 11 + 1);
   SetIndexDrawBegin(1, Bars - CountBars + 11 + 1);
   int l_ind_counted_8 = IndicatorCounted();
   int li_20 = RISK * 2 + 3;
   double ld_36 = RISK + 67;
   double ld_44 = 33 - RISK;
   int l_period_24 = li_20;
   if (Bars <= 12) return (0);
   if (l_ind_counted_8 < 12) {
      for (int li_0 = 1; li_0 <= 0; li_0++) g_ibuf_144[CountBars - li_0] = 0.0;
      for (li_0 = 1; li_0 <= 0; li_0++) g_ibuf_148[CountBars - li_0] = 0.0;
   }
   for (int li_4 = CountBars - 11 - 1; li_4 >= 0; li_4--) {
      li_12 = li_4;
      ld_76 = 0.0;
      ld_84 = 0.0;
      for (li_12 = li_4; li_12 <= li_4 + 9; li_12++) ld_84 += MathAbs(High[li_12] - Low[li_12]);
      ld_76 = ld_84 / 10.0;
      li_12 = li_4;
      ld_68 = 0;
      while (li_12 < li_4 + 9 && ld_68 < 1.0) {
         if (MathAbs(Open[li_12] - (Close[li_12 + 1])) >= 2.0 * ld_76) ld_68 += 1.0;
         li_12++;
      }
      if (ld_68 >= 1.0) ld_92 = li_12;
      else ld_92 = -1;
      li_12 = li_4;
      ld_68 = 0;
      while (li_12 < li_4 + 6 && ld_68 < 1.0) {
         if (MathAbs(Close[li_12 + 3] - Close[li_12]) >= 4.6 * ld_76) ld_68 += 1.0;
         li_12++;
      }
      if (ld_68 >= 1.0) ld_100 = li_12;
      else ld_100 = -1;
      if (ld_92 > -1.0) l_period_24 = 3;
      else l_period_24 = li_20;
      if (ld_100 > -1.0) l_period_24 = 4;
      else l_period_24 = li_20;
      ld_52 = 100 - MathAbs(iWPR(NULL, 0, l_period_24, li_4));
      lda_108[li_4] = ld_52;
      g_ibuf_144[li_4] = 0;
      g_ibuf_148[li_4] = 0;
      ld_60 = 0;
      if (ld_52 < ld_44) {
         for (int li_16 = 1; lda_108[li_4 + li_16] >= ld_44 && lda_108[li_4 + li_16] <= ld_36; li_16++) {
         }
         if (lda_108[li_4 + li_16] > ld_36) {
            ld_60 = High[li_4] + ld_76 / 2.0;
            g_ibuf_144[li_4] = ld_60;
         }
      }
      if (ld_52 > ld_36) {
         for (li_16 = 1; lda_108[li_4 + li_16] >= ld_44 && lda_108[li_4 + li_16] <= ld_36; li_16++) {
         }
         if (lda_108[li_4 + li_16] < ld_44) {
            ld_60 = Low[li_4] - ld_76 / 2.0;
            g_ibuf_148[li_4] = ld_60;
         }
      }
   }
   return (0);
}
Comments