GMMA Sashken_v1
Download script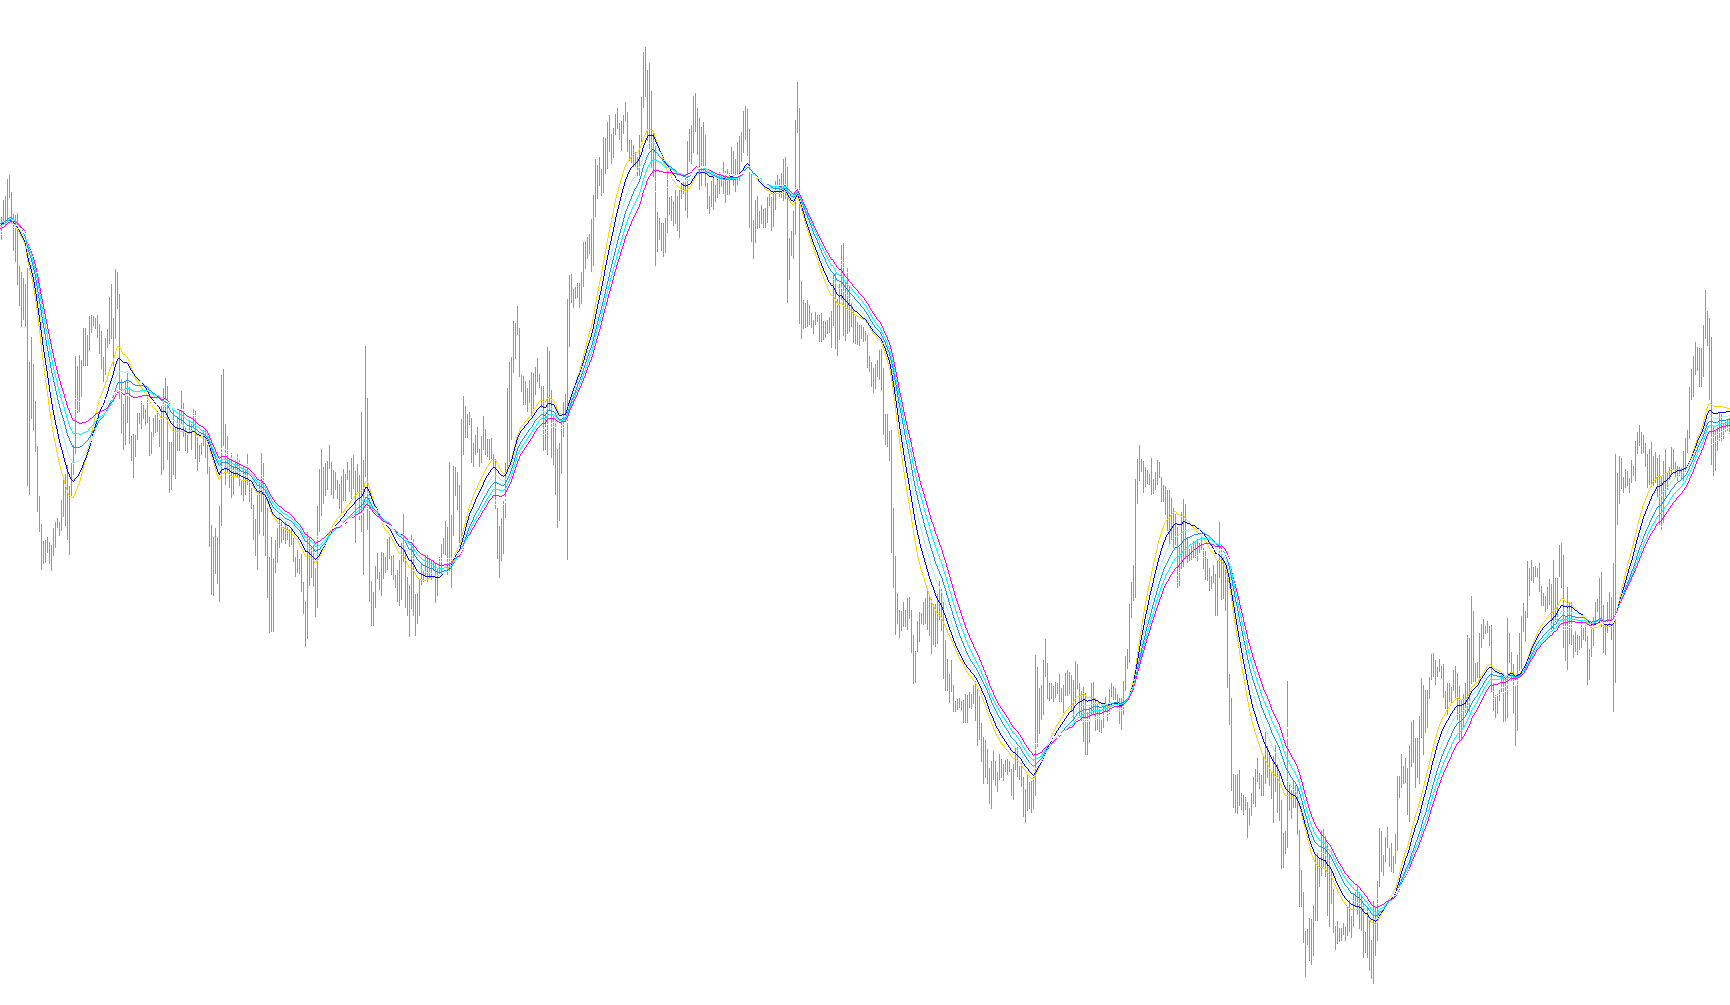
This script functions as a specialized technical analysis tool designed to help traders visualize market trends by calculating a series of moving averages simultaneously. It is specifically built as the "Long" component of the Guppy Multiple Moving Average (GMMA) strategy, which focuses on identifying the underlying momentum and price structure of a financial asset.
How the Logic Works
Instead of relying on a single moving average—which can often provide a lagging or incomplete picture of the market—this tool generates eight distinct lines plotted on your chart. These lines represent different time horizons, allowing you to see how different segments of the market (from short-term fluctuations to long-term trends) are behaving at once.
The Core Mechanics:
- Layered Calculation: The script takes a starting period (the "base" timeframe) and adds an incremental step to each subsequent line. For example, if your base period is 30 and your step is 5, the tool automatically calculates eight different averages: 30, 35, 40, 45, 50, 55, 60, and 65.
- Visual Organization: To make this data readable, the script organizes these eight lines into two distinct visual groups. The first four lines are colored in blue, representing shorter-term price movements. The remaining four lines are colored in magenta, representing longer-term trends.
- Trend Identification: By observing these two groups of lines, traders can identify "confluence." When the short-term lines (blue) align and move in the same direction as the long-term lines (magenta), it suggests a strong, healthy trend. Conversely, when these groups diverge or cross over one another, it can signal a potential shift in market sentiment or a period of consolidation.
Summary for Traders
Essentially, this script acts as a multi-layered "filter" for price action. It smooths out the market noise by calculating eight different speeds of movement at once. By observing the relationship between the blue and magenta clusters, you can more clearly see whether the immediate momentum is supported by the broader long-term trend, helping to filter out false signals that might appear on simpler charts.
//+------------------------------------------------------------------+
//|                        Guppy Mulitple Moving Average (Long).mq4 |
//|                                  Code written by - Matt Trigwell |
//|                                                                  |
//+------------------------------------------------------------------+

// ***** INSTRUCTIONS *****
// Add the GMMA Short indicator and the GMMA Long indicator to your charts.
// This is the GMMA Long indicator

// ***** For information on how to use this fantastic indicator *****
// http://www.guppytraders.com/
// http://www.market-analyst.com/kb/article.php/Guppy_Multiple_Moving_Average
// http://tradermike.net/2004/05/another_look_at_multiple_moving_averages


#property copyright "Code written by - Matt Trigwell"

#property indicator_chart_window
#property indicator_buffers 8
#property indicator_color1 Blue
#property indicator_color2 Blue
#property indicator_color3 Blue
#property indicator_color4 Blue
#property indicator_color5 Magenta
#property indicator_color6 Magenta
#property indicator_color7 Magenta
#property indicator_color8 Magenta

extern int MaPeriod=30;
extern int Step=5;
extern int MaMode=3;
extern int Price=0;


//---- buffers
double ExtMapBuffer1[];
double ExtMapBuffer2[];
double ExtMapBuffer3[];
double ExtMapBuffer4[];
double ExtMapBuffer5[];
double ExtMapBuffer6[];
double ExtMapBuffer7[];
double ExtMapBuffer8[];

//+------------------------------------------------------------------+
//| Custom indicator initialization function                         |
//+------------------------------------------------------------------+
int init()
  {
//---- indicators
   SetIndexStyle(0,DRAW_LINE);
   SetIndexBuffer(0,ExtMapBuffer1);
   SetIndexStyle(1,DRAW_LINE);
   SetIndexBuffer(1,ExtMapBuffer2);
   SetIndexStyle(2,DRAW_LINE);
   SetIndexBuffer(2,ExtMapBuffer3);
   SetIndexStyle(3,DRAW_LINE);
   SetIndexBuffer(3,ExtMapBuffer4);
   SetIndexStyle(4,DRAW_LINE);
   SetIndexBuffer(4,ExtMapBuffer5);
   SetIndexStyle(5,DRAW_LINE);
   SetIndexBuffer(5,ExtMapBuffer6);
   SetIndexStyle(6,DRAW_LINE);
   SetIndexBuffer(6,ExtMapBuffer7);
   SetIndexStyle(7,DRAW_LINE);
   SetIndexBuffer(7,ExtMapBuffer8);
//----
   return(0);
  }

int deinit()
  {
   return(0);
  }

int start()
  {
   int i,j,limit,counted_bars=IndicatorCounted();


   if(counted_bars<0) return(-1);
   if(counted_bars>0) counted_bars--;
   limit=Bars-counted_bars;

   for(i=0; i<limit; i++){
      ExtMapBuffer1[i]=iMA(NULL,0,MaPeriod,0,MaMode,Price,i);
      ExtMapBuffer2[i]=iMA(NULL,0,MaPeriod+Step,0,MaMode,Price,i);
      ExtMapBuffer3[i]=iMA(NULL,0,MaPeriod+Step*2,0,MaMode,Price,i);
      ExtMapBuffer4[i]=iMA(NULL,0,MaPeriod+Step*3,0,MaMode,Price,i);
      ExtMapBuffer5[i]=iMA(NULL,0,MaPeriod+Step*4,0,MaMode,Price,i);
      ExtMapBuffer6[i]=iMA(NULL,0,MaPeriod+Step*5,0,MaMode,Price,i);
      ExtMapBuffer7[i]=iMA(NULL,0,MaPeriod+Step*6,0,MaMode,Price,i);
      ExtMapBuffer8[i]=iMA(NULL,0,MaPeriod+Step*7,0,MaMode,Price,i);
   }


   return(0);
  }
//+------------------------------------------------------------------+
Comments