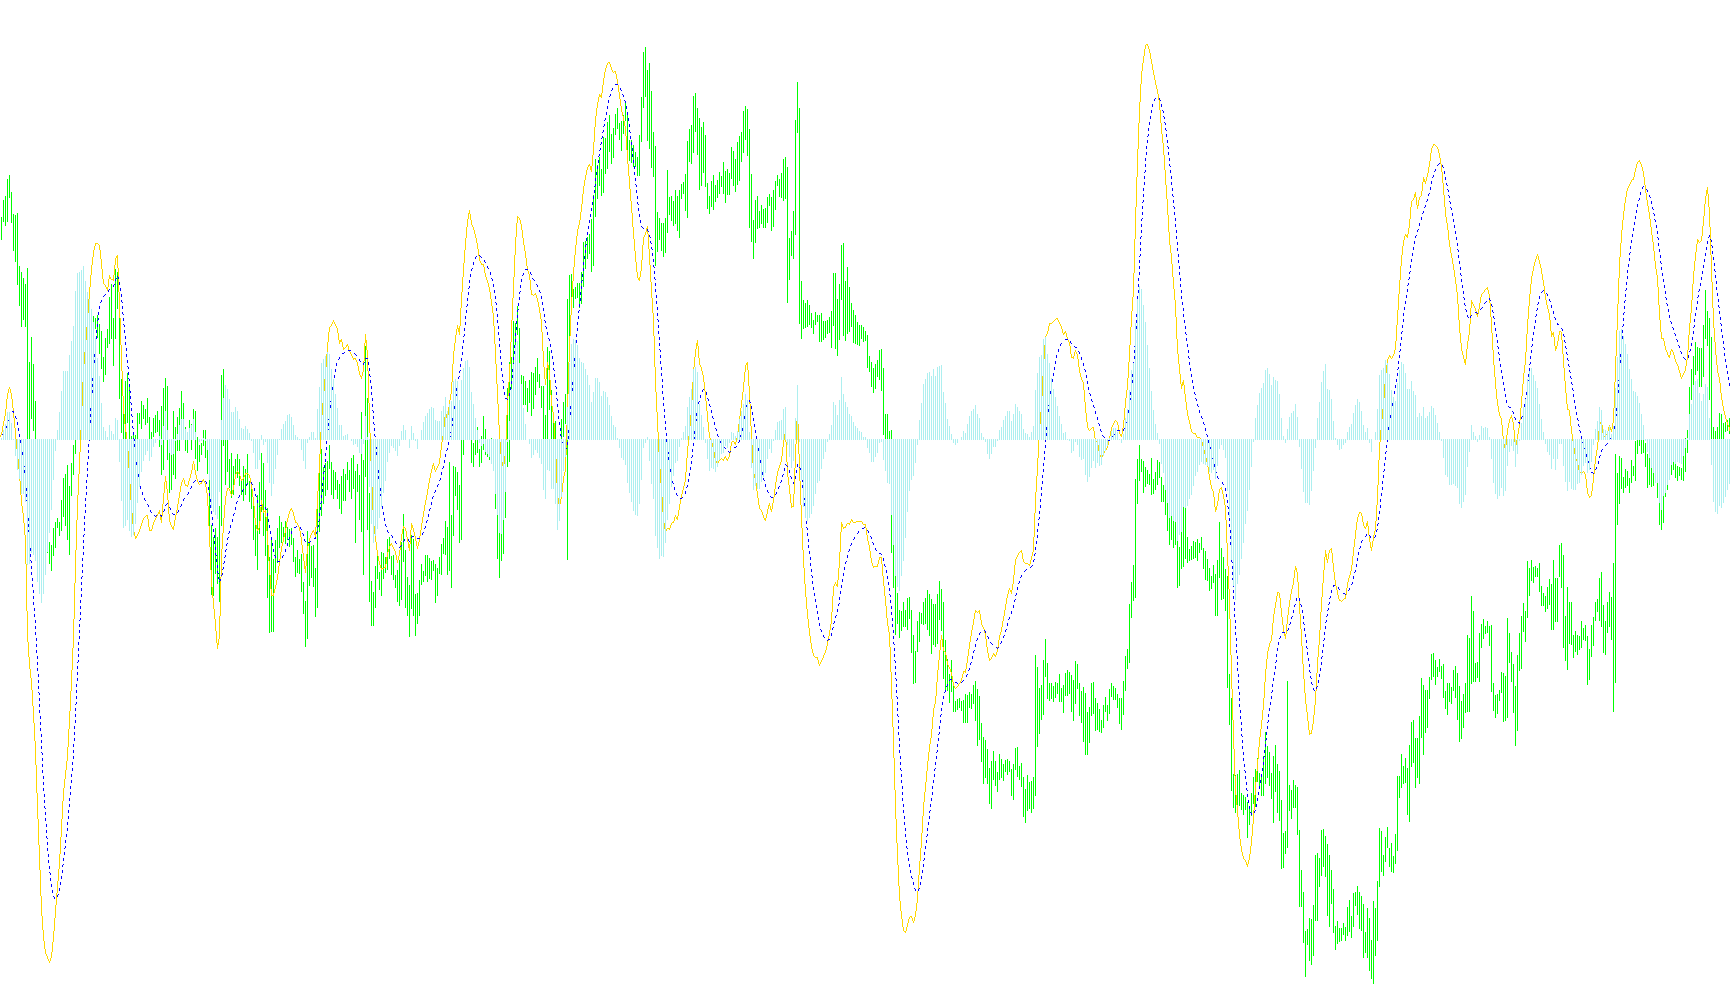
This script is designed to create a specialized visual tool for analyzing market trends, specifically by calculating and displaying the Moving Average Convergence Divergence (MACD). It functions as an independent charting element that helps traders identify momentum shifts and potential price reversals by tracking the relationship between two different moving averages.
Core Components of the Logic
The tool processes price data to generate three distinct visual elements on your chart:
1. The MACD Line The logic first looks at the "fast" average price movement over a short period and compares it to a "slow" average price movement over a longer period. By subtracting the slow average from the fast average, the script produces the MACD line. This represents the immediate velocity of the market; when this line is high, it suggests bullish momentum, while a low position suggests bearish momentum.
2. The Signal Line To smooth out the fluctuations of the MACD line and provide a clearer picture of long-term trends, the script calculates a "Signal Line." This is essentially a moving average of the MACD line itself. It uses a specific mathematical smoothing factor (alpha) to balance current data with previous results, creating a dotted reference line that helps traders identify when momentum is reaching an extreme or beginning to turn.
3. The Histogram The final visual component is a bar chart (histogram). This represents the distance between the MACD Line and the Signal Line.
- When the histogram bars are above zero, it indicates that the fast momentum is stronger than the average momentum.
- When the bars drop below zero, it suggests the slow momentum is taking over.
- The growing or shrinking size of these bars provides a visual cue regarding the strength of the current trend.
How It Operates
Every time the market updates, the script automatically recalculates these values starting from the most recent price data and moving backward to ensure the chart is always current. By providing these three layers of information—the primary momentum (MACD), the smoothed trend (Signal), and the visual difference between them (Histogram)—the script allows you to see not just where the price is going, but how quickly and with what intensity it is moving in that direction.
//+------------------------------------------------------------------+
//|                                                         MACD.mq4 |
//|                                Copyright © 2005, David W. Thomas |
//|                                           mailto:davidwt@usa.net |
//+------------------------------------------------------------------+
// This is the correct computation and display of MACD.
#property copyright "Copyright © 2005, David W. Thomas"
#property link      "mailto:davidwt@usa.net"

#property indicator_separate_window
#property indicator_buffers 3
#property indicator_color1 Blue
#property indicator_color2 Red
#property indicator_color3 Green

//---- input parameters
extern int       FastMAPeriod=12;
extern int       SlowMAPeriod=26;
extern int       SignalMAPeriod=9;

//---- buffers
double MACDLineBuffer[];
double SignalLineBuffer[];
double HistogramBuffer[];

//---- variables
double alpha = 0;
double alpha_1 = 0;

//+------------------------------------------------------------------+
//| Custom indicator initialization function                         |
//+------------------------------------------------------------------+
int init()
{
   IndicatorDigits(MarketInfo(Symbol(),MODE_DIGITS)+1);
   //---- indicators
   SetIndexStyle(0,DRAW_LINE);
   SetIndexBuffer(0,MACDLineBuffer);
   SetIndexDrawBegin(0,SlowMAPeriod);
   SetIndexStyle(1,DRAW_LINE,STYLE_DOT);
   SetIndexBuffer(1,SignalLineBuffer);
   SetIndexDrawBegin(1,SlowMAPeriod+SignalMAPeriod);
   SetIndexStyle(2,DRAW_HISTOGRAM);
   SetIndexBuffer(2,HistogramBuffer);
   SetIndexDrawBegin(2,SlowMAPeriod+SignalMAPeriod);
   //---- name for DataWindow and indicator subwindow label
   IndicatorShortName("MACD("+FastMAPeriod+","+SlowMAPeriod+","+SignalMAPeriod+")");
   SetIndexLabel(0,"MACD");
   SetIndexLabel(1,"Signal");
   //----
	alpha = 2.0 / (SignalMAPeriod + 1.0);
	alpha_1 = 1.0 - alpha;
   //----
   return(0);
}
//+------------------------------------------------------------------+
//| Custor indicator deinitialization function                       |
//+------------------------------------------------------------------+
int deinit()
{
   //----

   //----
   return(0);
}
//+------------------------------------------------------------------+
//| Custom indicator iteration function                              |
//+------------------------------------------------------------------+
int start()
{
   int limit;
   int counted_bars = IndicatorCounted();
   //---- check for possible errors
   if (counted_bars<0) return(-1);
   //---- last counted bar will be recounted
   if (counted_bars>0) counted_bars--;
   limit = Bars - counted_bars;

   for(int i=limit; i>=0; i--)
   {
      MACDLineBuffer[i] = iMA(NULL,0,FastMAPeriod,0,MODE_EMA,PRICE_CLOSE,i) - iMA(NULL,0,SlowMAPeriod,0,MODE_EMA,PRICE_CLOSE,i);
      SignalLineBuffer[i] = alpha*MACDLineBuffer[i] + alpha_1*SignalLineBuffer[i+1];
      HistogramBuffer[i] = MACDLineBuffer[i] - SignalLineBuffer[i];
   }

   //----
   return(0);
}
//+------------------------------------------------------------------+
Comments