Gideon's_ATR_v1
Download script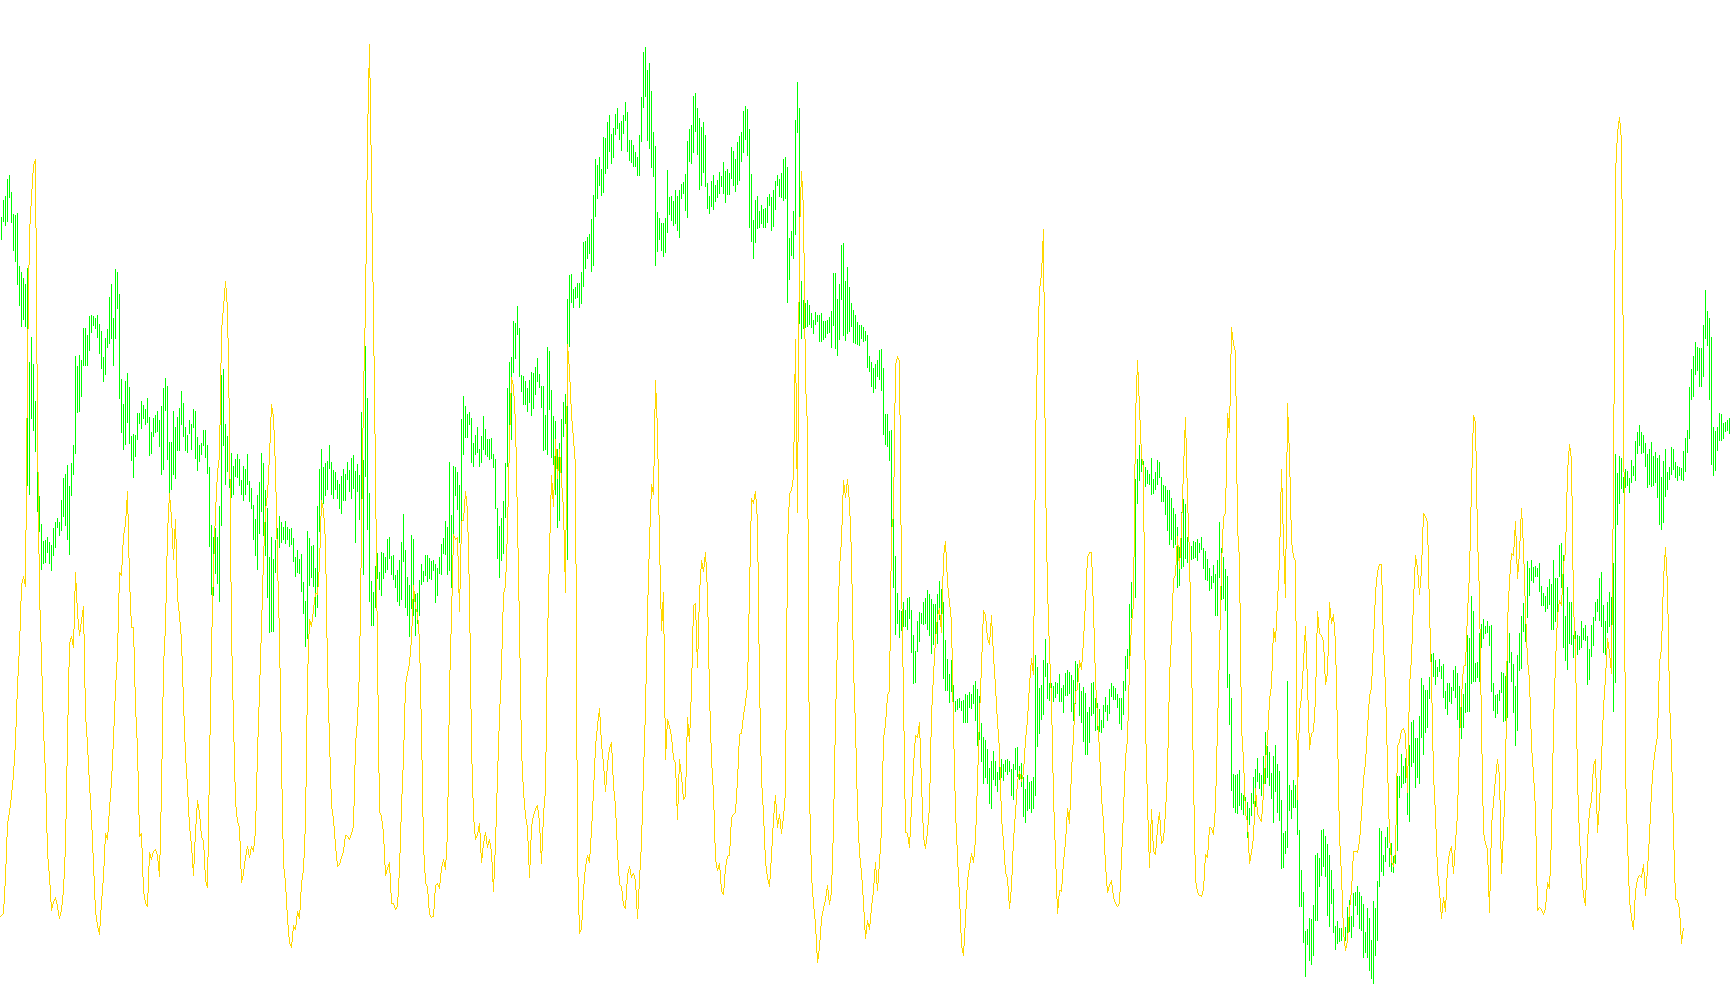
This tool is designed to help traders visualize and interpret market volatility by comparing different speeds of price movement. Instead of looking at raw price changes, it processes data into a smoothed signal that highlights shifts in how the market is behaving.
How the Logic Works
The script operates through a two-step calculation process:
1. The Volatility Ratio (The Signal) The core logic begins by looking at "Average True Range" (ATR). In simple terms, ATR measures how much an asset moves on average over a specific period. This script compares two different versions of this movement: a "Fast" version and a "Slow" version.
By dividing the Fast volatility by the Slow volatility, the script creates a ratio. This tells you whether the current market turbulence is higher or lower than it has been recently. If the resulting line moves up, it suggests that recent price swings are becoming more aggressive compared to the longer-term average; if it moves down, the market is becoming calmer relative to its history.
2. The Smoothing Filter (The Moving Average) Because raw volatility ratios can sometimes be jumpy or erratic, the script applies a second layer of processing. It takes that first ratio and runs it through a "Smoothed Moving Average" calculation.
This acts as a filter, ironing out the small, insignificant fluctuations to reveal the broader trend of the volatility. The final result is a clean line on your chart that helps you identify when the underlying "mood" of the market's activity is truly changing, rather than reacting to a single momentary spike.
Summary for Traders
Essentially, this indicator takes complex price data and boils it down into a simplified trend line. It allows you to see the relationship between short-term energy and long-term stability, helping you identify periods of expanding or contracting market activity more clearly.
//+------------------------------------------------------------------+
//|                                                 Gideons_ATR.mq4 |
//|                       Copyright © 2007, GideonSmolders@gmail.com |
//|                                           MetaTrader Group Yahoo |
//+------------------------------------------------------------------+
#property copyright "Copyright © 2007, GideonSmolders"
#property link      ""
//---- indicator settings
#property  indicator_separate_window
#property  indicator_buffers 2
#property  indicator_color1  Silver
#property  indicator_color2  Red
//---- indicator parameters
extern int       atr_fast=5;
extern int       atr_slow=48;


//---- indicator buffers
double     ind_buffer1[];
double     ind_buffer2[];

//+------------------------------------------------------------------+
//| Custom indicator initialization function                         |
//+------------------------------------------------------------------+
int init()
  {
//---- drawing settings
   SetIndexStyle(0,DRAW_LINE);
   SetIndexStyle(1,DRAW_LINE);
   SetIndexDrawBegin(0,atr_slow);
   SetIndexDrawBegin(1,atr_slow);
   IndicatorDigits(MarketInfo(Symbol(),MODE_DIGITS)+1);
//---- indicator buffers mapping
   if(!SetIndexBuffer(0,ind_buffer1) && !SetIndexBuffer(1,ind_buffer2))
      Print("cannot set indicator buffers!");
//---- name for DataWindow and indicator subwindow label
   IndicatorShortName("Gideons ATR("+atr_fast+","+atr_slow+")");
   SetIndexLabel(0,"ATR_Signal");
   SetIndexLabel(1,"MA");
//---- initialization done
   return(0);
  }
//+------------------------------------------------------------------+
//+------------------------------------------------------------------+
int start()
  {
   int limit;
   int counted_bars=IndicatorCounted();
//---- check for possible errors
   if(counted_bars<0) return(-1);
//---- last counted bar will be recounted
   if(counted_bars>0) counted_bars--;
   limit=Bars-counted_bars;
//---- atr signal counted in the 1-st buffer
   for(int i=0; i<limit; i++)
      ind_buffer1[i]= iATR(NULL,0,atr_fast,i)/iATR(NULL,0,atr_slow,i);

//---- ma line counted in the 2-nd buffer
   for(i=0; i<limit; i++)
      ind_buffer2[i]=iMAOnArray(ind_buffer1,0,7,0,MODE_SMMA,i);
//---- done
   return(0);
  }
Comments