Gold Spread of Williams
Download script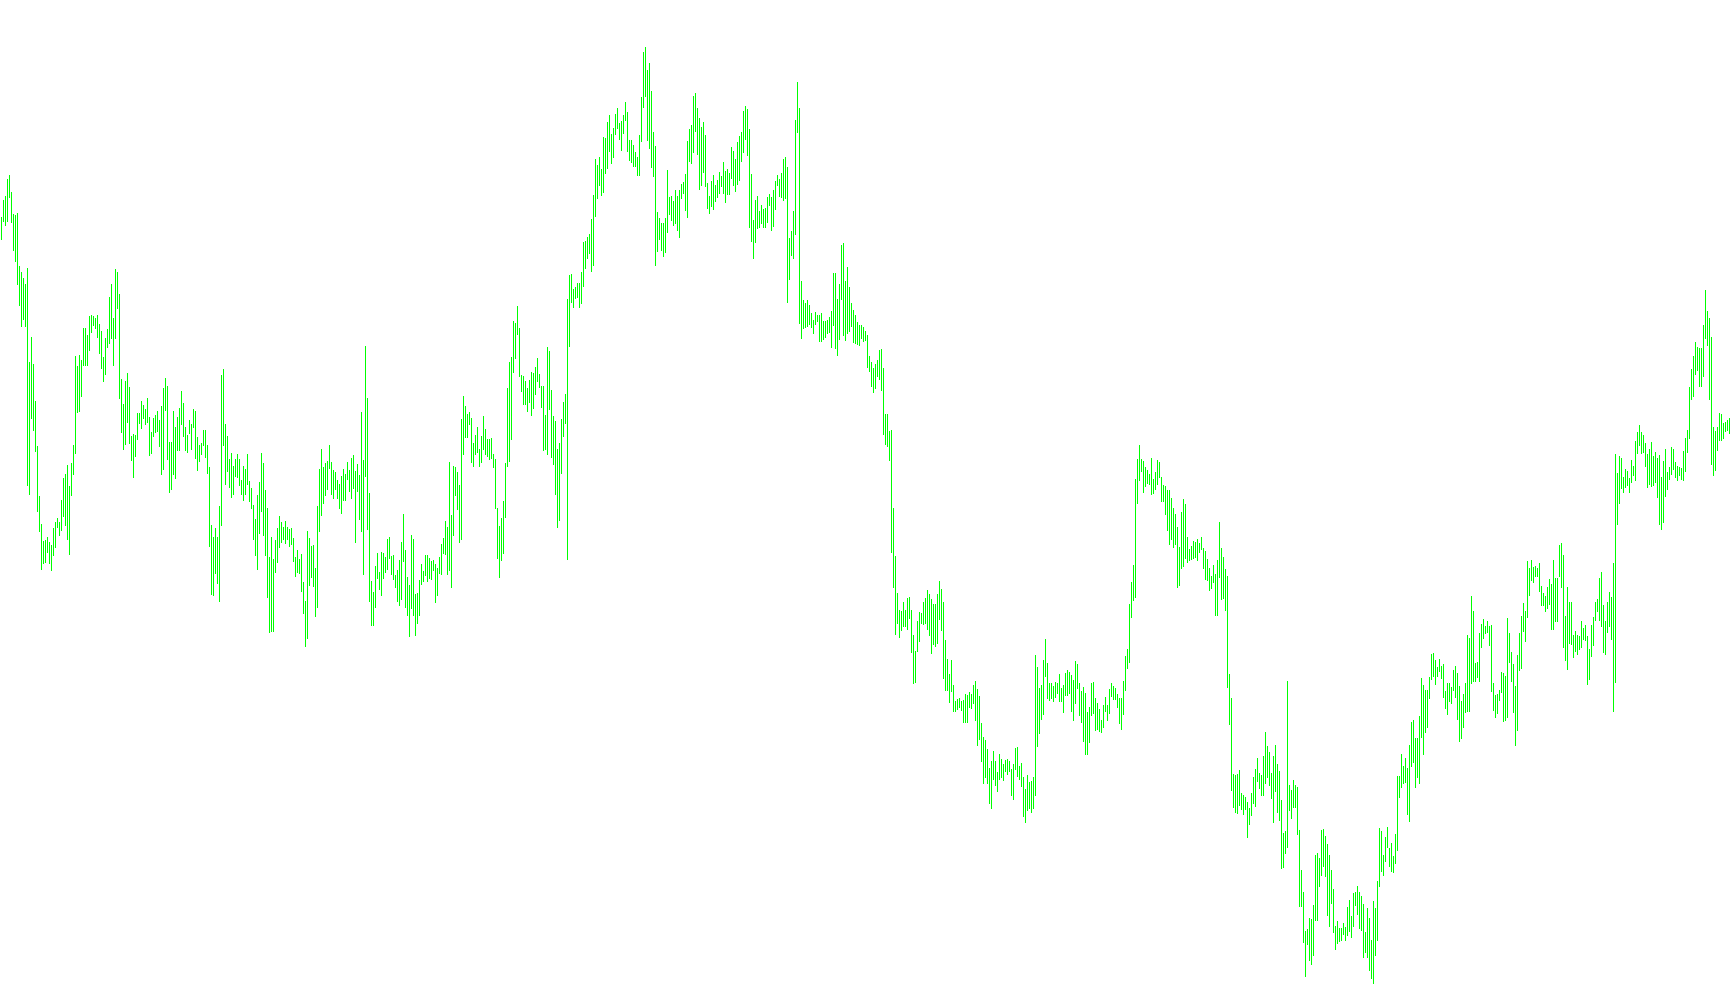
This script is designed as a custom technical indicator for the MetaTrader platform, specifically created to help traders monitor and visualize the "spread" or price difference between two specific financial instruments. In this case, it focuses on the relationship between Gold and a Dollar Index (DX_CONT).
Core Functionality
The primary purpose of this tool is to track how the price gap between these two assets fluctuates over time. Instead of looking at the prices of Gold or the Dollar Index in isolation, this indicator allows you to see the dynamic "distance" between them on a single chart.
How the Logic Works
The script processes data through three distinct stages:
1. Identifying the Instruments The user provides the specific name of a Dollar Index (the reference currency) in the settings. The script then constantly monitors the current market prices of both that index and the asset currently displayed on your main chart (Gold).
2. Calculating the Raw Spread For every historical candle on your chart, the script calculates the mathematical difference between the closing price of the Dollar Index and the closing price of the current asset. This result is stored as a raw "spread" value, representing the gap between the two markets at any given moment.
3. Smoothing and Normalizing the Data To make the data easier for a human to read and less "noisy" (jittery), the script applies a specialized smoothing technique:
- It calculates two different types of moving averages based on the raw spread data—one using a long-term average (21 periods) and one using a short-term average (3 periods).
- It subtracts the short-term average from the long-term average to isolate the momentum of the spread.
- Finally, it scales this result down by a factor of 100 to ensure the values are displayed in a manageable range on your screen.
Visual Representation
The final output appears in a separate window below your main price chart. The script automatically sets reference levels (at 0.3 and -0.3) to help you identify significant deviations. When the line moves above or below these markers, it indicates that the price relationship between Gold and the Dollar Index is shifting significantly from its normal trend.
//+------------------------------------------------------------------+
//|                                                   GoldSpread.mq4 |
//|                      Copyright © 2009, C-4, All Rights Reserved. |
//|                                                   vs-box@mail.ru |
//+------------------------------------------------------------------+
#property copyright "Copyright © 2009, C-4, All Rights Reserved."
#property link      "vs-box@mail.ru"

#property indicator_separate_window
#property  indicator_buffers 1
#property  indicator_color1  Red
extern string symbol_name="DX_CONT";//Íàçâàíèå èíñòðóìåíòà èíäåêñà äîëëàðà, âûñòàâëÿåòñÿ âðó÷íóþ.

double GoldSpread[],
       SpreadDG[];

int init()
{
   IndicatorBuffers(2);
   SetIndexBuffer(0,GoldSpread);
   SetIndexBuffer(1,SpreadDG);
   IndicatorShortName("Gold Spread of Williams");
   SetLevelValue(0,0.0);
   SetLevelValue(1,0.3);
   SetLevelValue(2,-0.3);
   if(iTime(symbol_name,0,0)==0){
      Print("Óêàçàíî íåñóùåñòâóþùåå íàçâàíèå èíñòðóìåíòà. Äàëüíåéøåå îòîáðàæåíèå èíäèêàòîðà áóäåò íåâîçìîæíî.");
      Print("Ïðèñâîéòå ïåðåìåííîé symbol_name íàçâàíèå ñóùåñòâóþùåãî èíñòðóìåíòà(èíäåêñà äîëëàðà).");
   }
   return(0);
}

int start()
{
   if(iBars(symbol_name,0)==0)return(1);
   int limit,counted_bars;
   counted_bars=IndicatorCounted();
   limit=Bars-counted_bars;
   for(int i=0; i<limit; i++){
      SpreadDG[i]=iClose(symbol_name,0,i)-iClose(Symbol(),0,i);
   }
   for(i=0; i<limit; i++){
      GoldSpread[i]=(iMAOnArray(SpreadDG,Bars,21,0,MODE_SMA,i)-iMAOnArray(SpreadDG,Bars,3,0,MODE_SMA,i))/100;
   }
}
Comments