Graal
Indicator

Graal

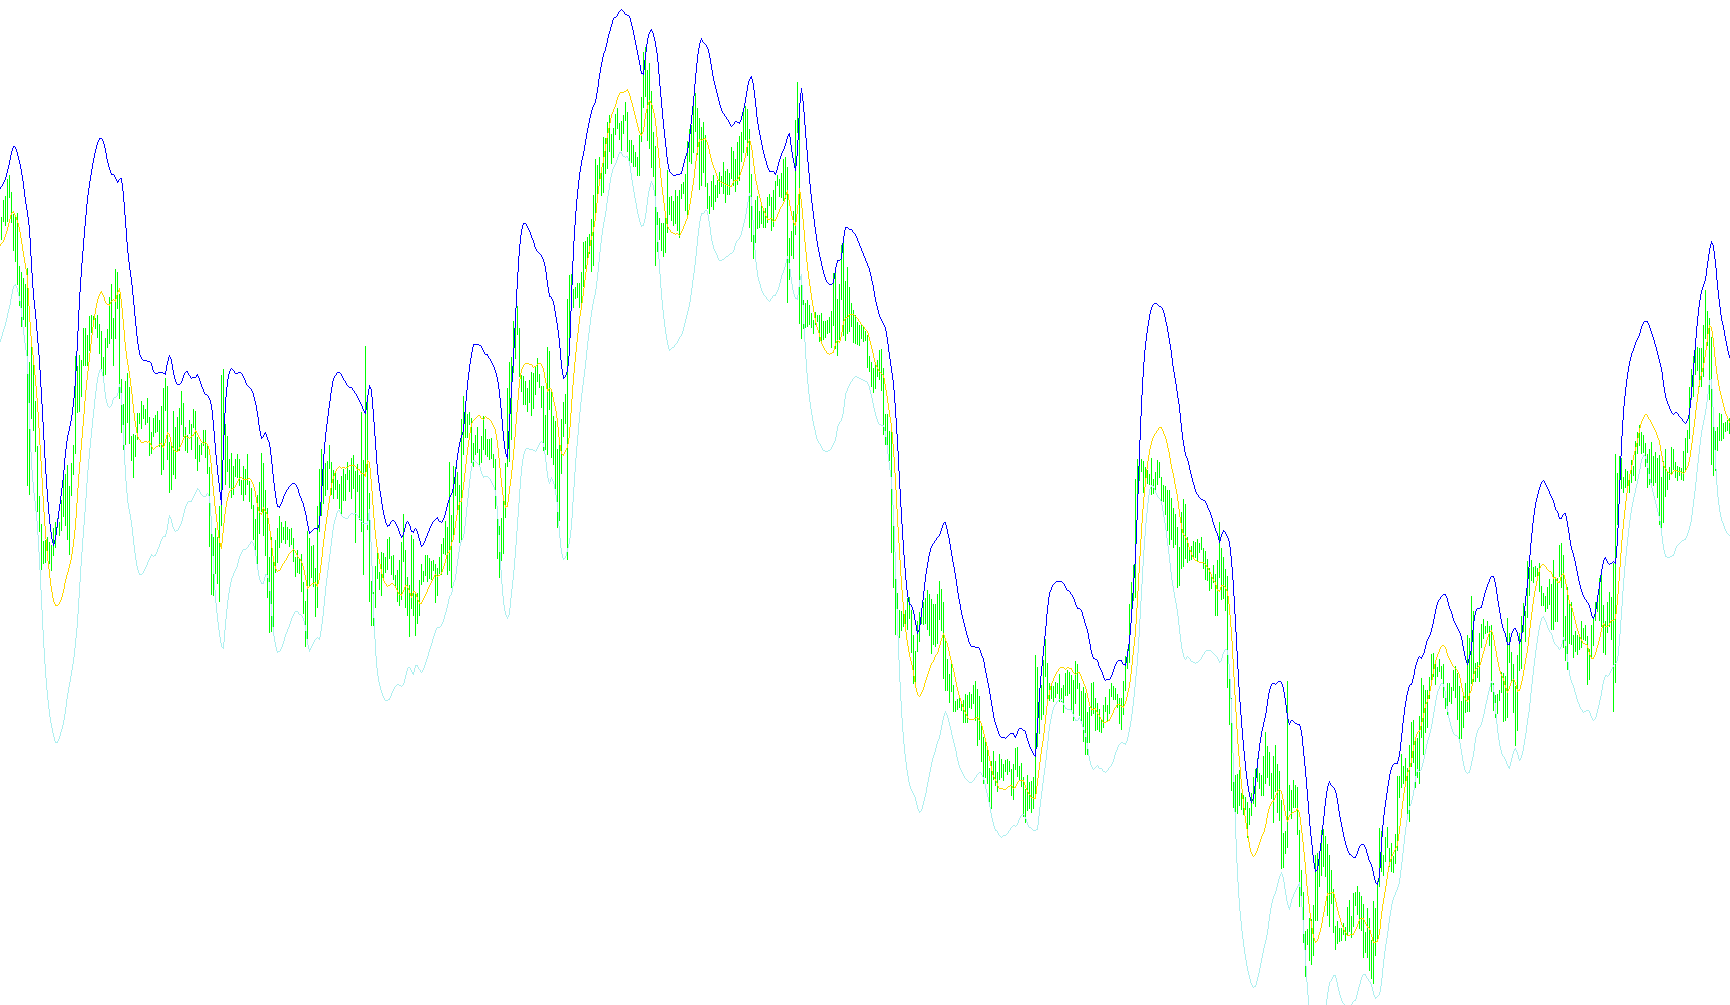
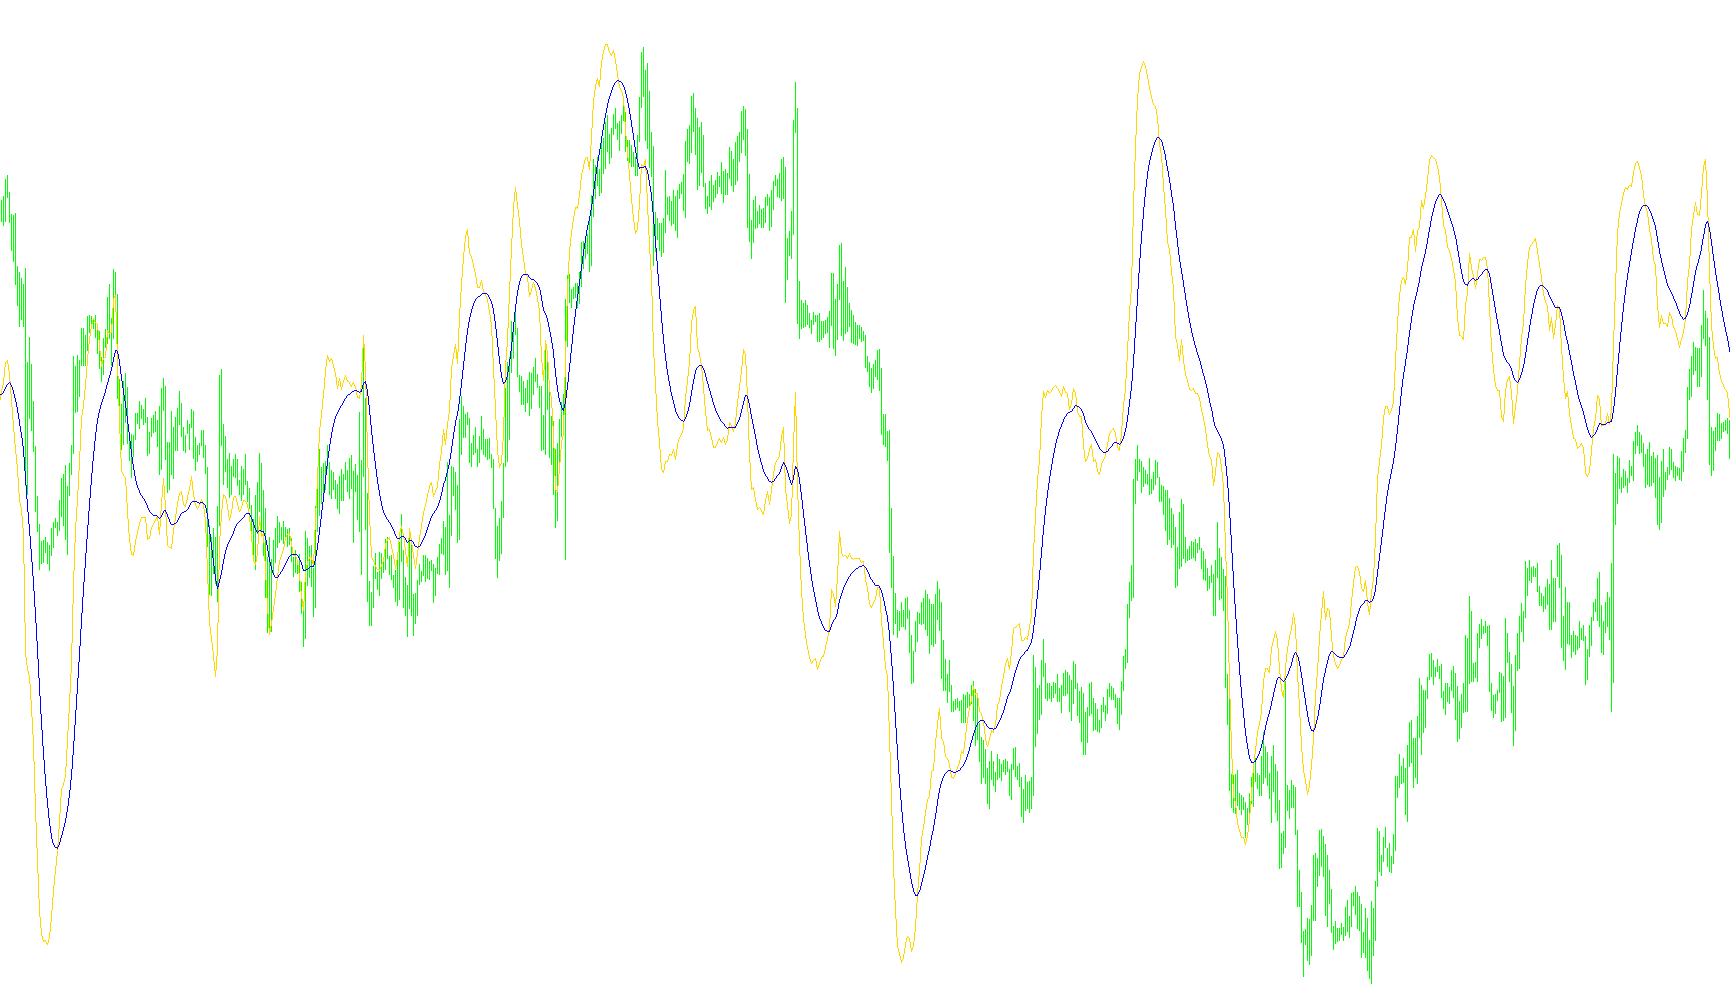
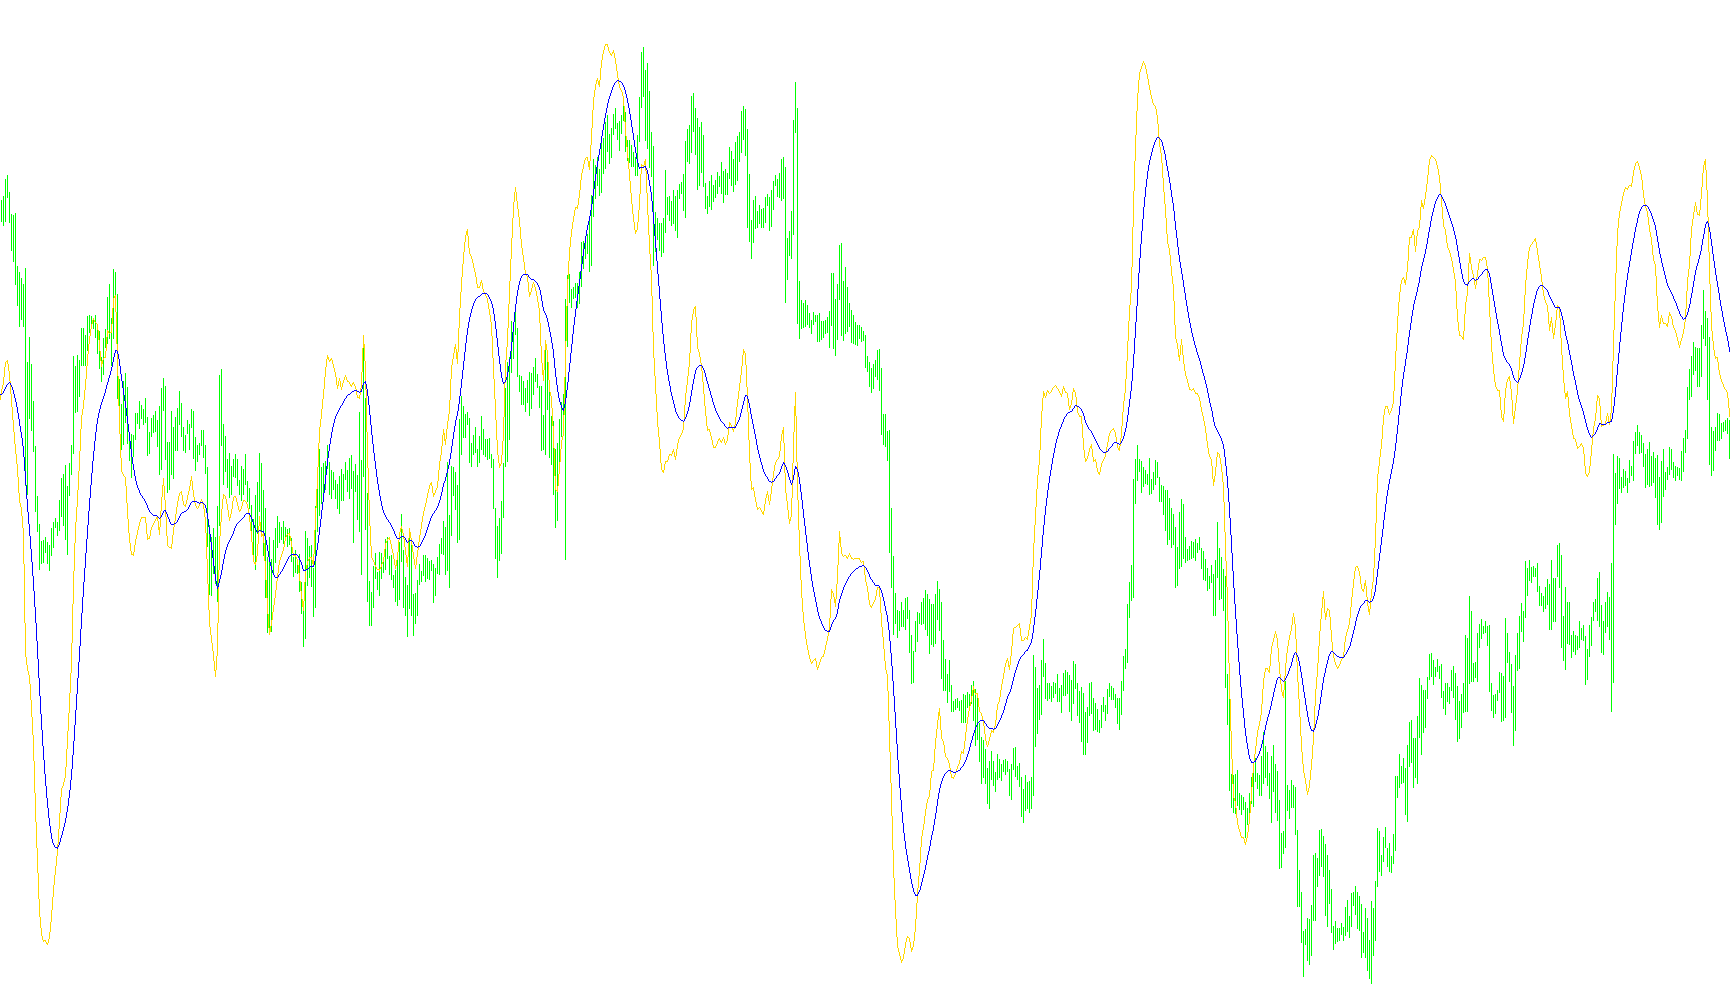
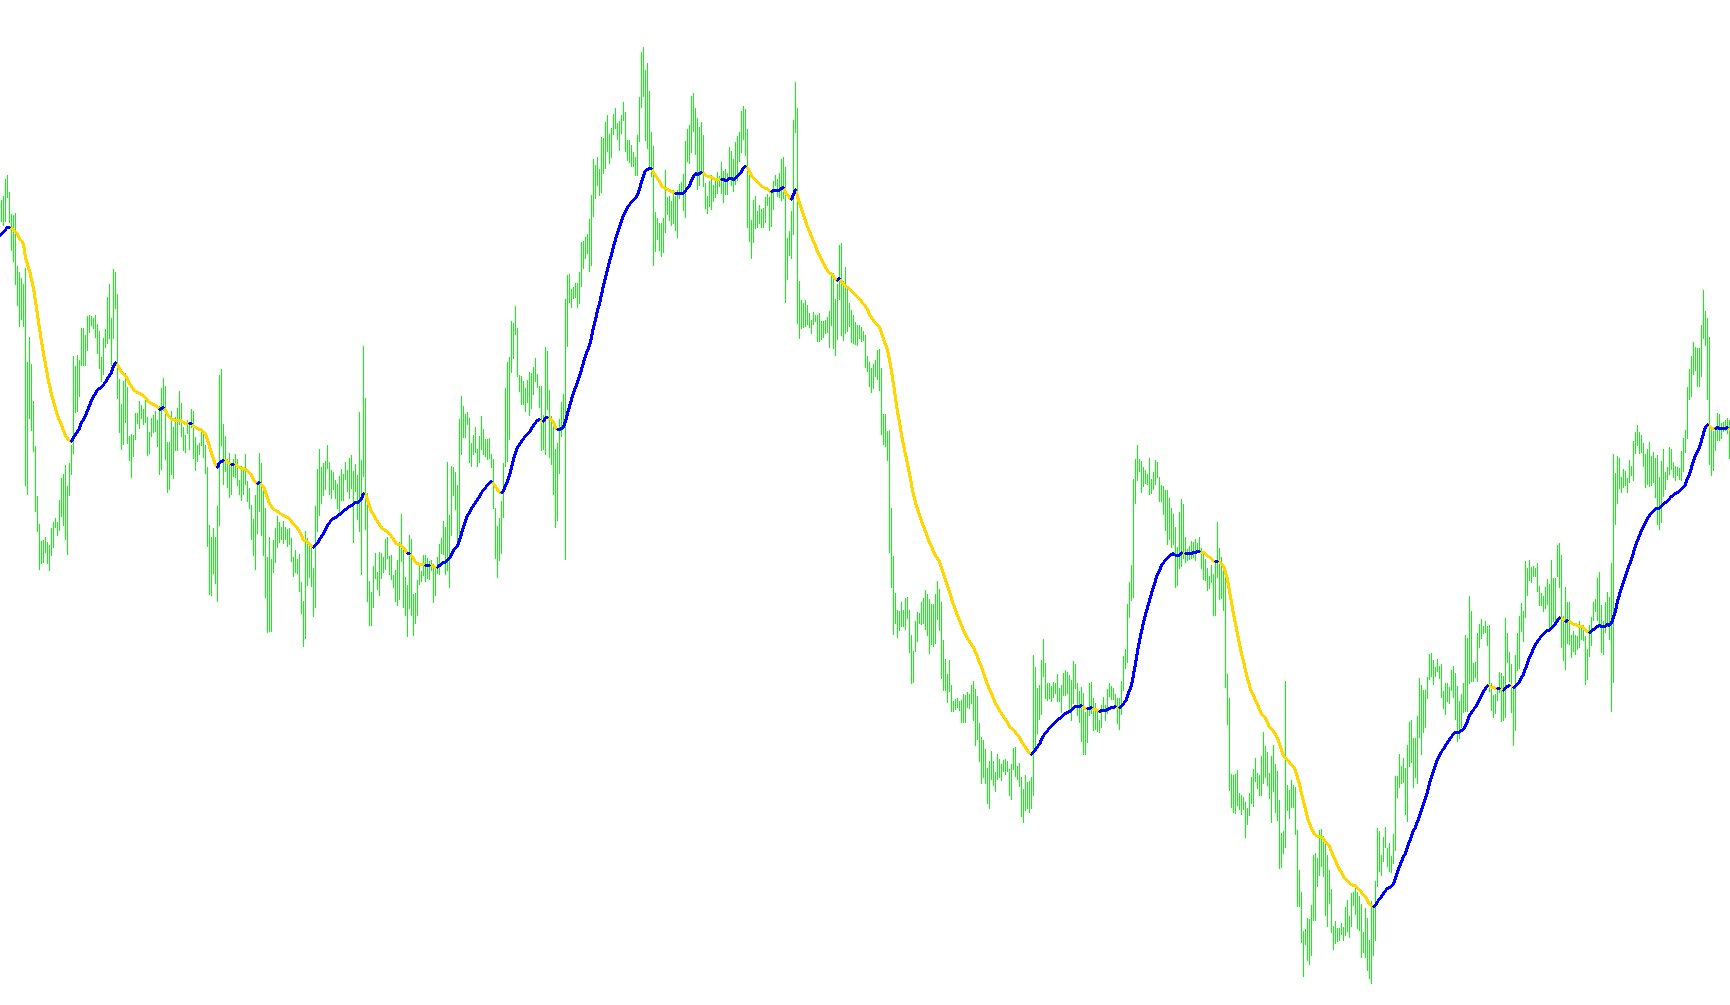
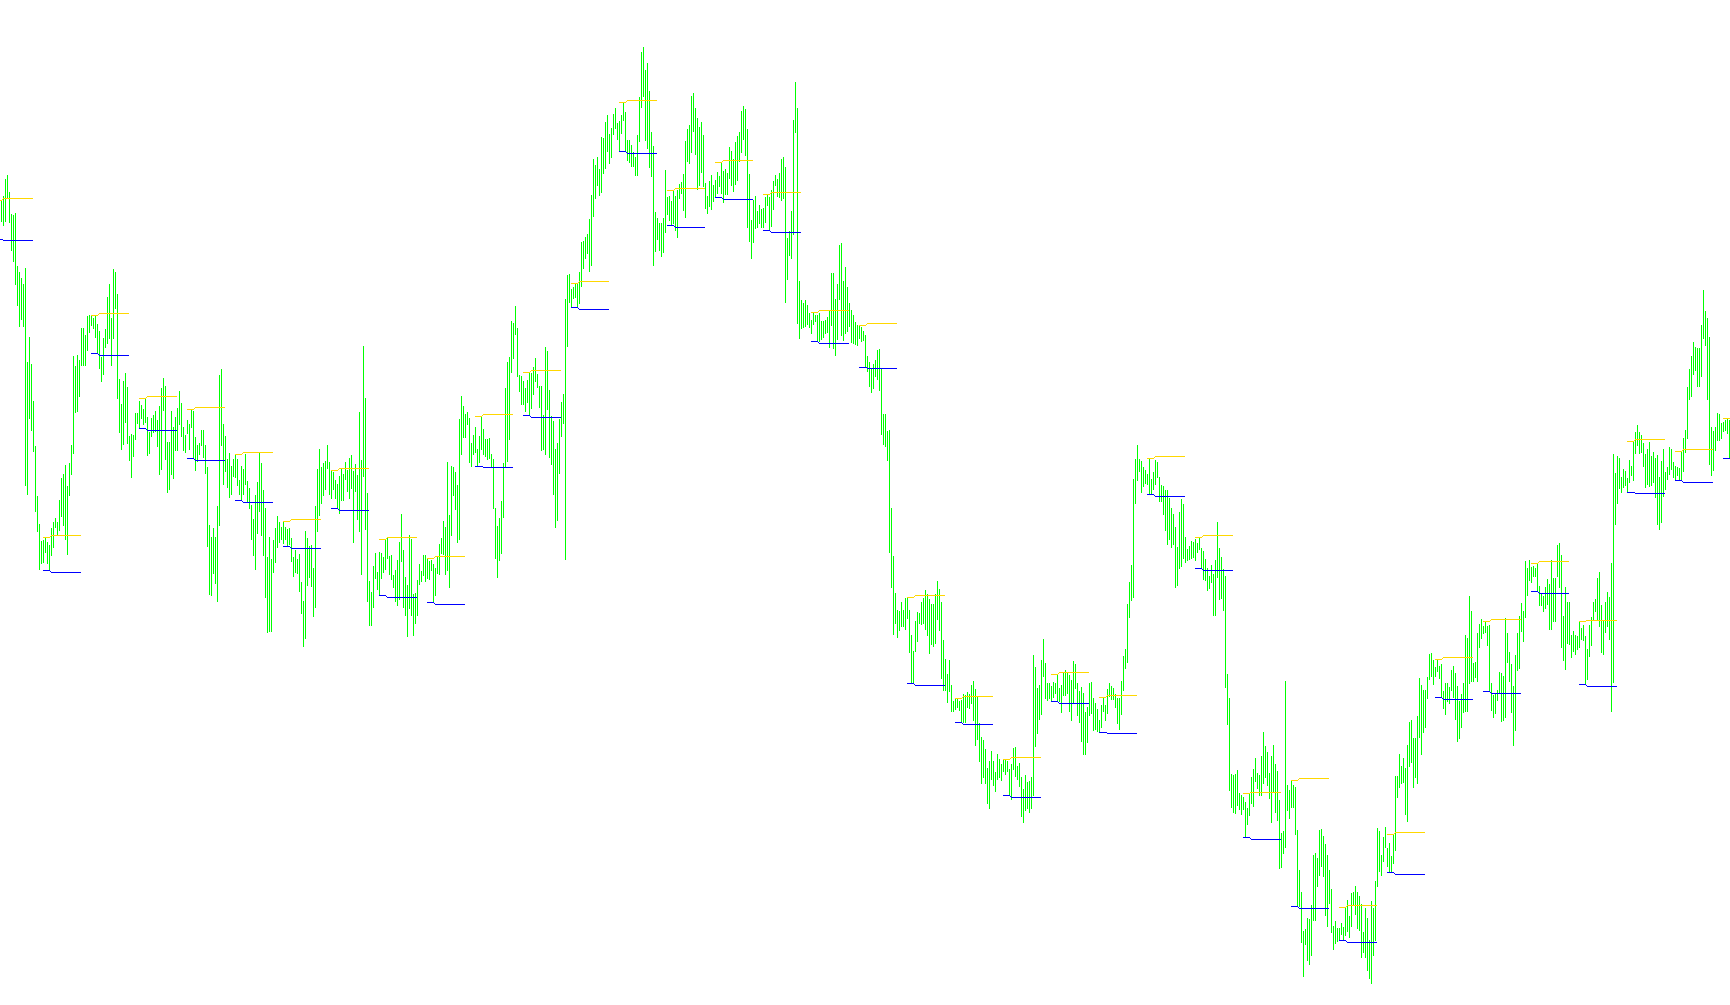
A multi-modal technical indicator providing interchangeable SMA, EMA, SMMA, and LWMA smoothing calculations to track price trends.

GrabBuffers
Indicator

GrabBuffers

This utility retrieves and logs raw numerical data from multiple external indicator buffers to identify underlying trends, color signals, and crossover points without needing the original source code.

grabweb
Indicator

grabweb

This script utilizes Windows Internet APIs to establish a direct connection with a specified URL and retrieve raw data into a local buffer.

grabweb1
Indicator

grabweb1

This expert advisor utilizes the wininet.dll library to fetch real-time economic data from web sources and parses it into structured CSV files for trade analysis.

grabweb2
Indicator

grabweb2

The script utilizes Windows Internet (wininet.dll) libraries to fetch live economic calendar HTML data from a remote URL and persist it into a local daily timestamped file.

grabweb_for_NewsTracker V1_1
Indicator

grabweb_for_NewsTracker V1_1

This expert advisor fetches real-time economic data from a web source via wininet.dll and parses it into a structured CSV file for automated market monitoring.

grabweb_for_NewsTracker
Indicator

grabweb_for_NewsTracker

This expert advisor retrieves live economic calendar data from a web URL via DLL calls and parses the HTML content into a structured CSV file based on specific volatility levels.

grabweb_for_NewsTracker_v1
Indicator

grabweb_for_NewsTracker_v1

This automated utility fetches economic calendar data from a web source via DLL calls and parses the raw HTML to export specific news events into a structured CSV file.

Gramski Alert EA
Indicator

Gramski Alert EA

Identifies trend reversals by detecting crossovers of the Laguerre RSI threshold levels synchronized with positive Absolute Strength Histogram momentum.

GraphOnGrap
Indicator

GraphOnGrap

This indicator extracts and visualizes specific price components—Open, Close, or Median—from a user-defined symbol to create a distinct historical trajectory.

Indicator

GRFKalman

Indicator

GRFKalmanAG

GRFKalmanAGASJW
Indicator

GRFKalmanAGASJW

This indicator utilizes a recursive Kalman filter with automated gain scaling and matrix-based state propagation to dynamically track price dynamics and project volatility boundaries.

GRFKalmanAGJW
Indicator

GRFKalmanAGJW

This indicator utilizes a recursive Kalman Filter to estimate hidden market states, providing real-time trend tracking with dynamic noise suppression and multi-step price projection capabilities.

GRFKalmanJW
Indicator

GRFKalmanJW

Utilizes a recursive matrix-based Kalman filter to estimate underlying price trends and dynamic volatility boundaries through real-time innovation error propagation.

GRFLeadingEdge
Indicator

GRFLeadingEdge

This indicator employs a Least Squares Square (LSQ) line fitting algorithm to project a trendline based on the geometric mean of price data, enveloped by dynamic standard deviation bands.

GRFMatrixMath
Indicator

GRFMatrixMath

A comprehensive library providing fundamental multi-dimensional array operations including addition, multiplication, transposition, and determinant-based inversion for MQL4 environments.

Grid Builder
Indicator

Grid Builder

This tool automatically populates horizontal price levels across the visual range of recent highs and lows to establish a structured grid for systematic trade planning.

Grid Builder_001
Indicator

Grid Builder_001

This indicator automatically projects a series of equidistant horizontal price markers across the local high and low volatility boundaries.

Grid Builder_v1
Indicator

Grid Builder_v1

This indicator identifies the recent peak and trough price extremes to automatically plot a geometrically equidistant horizontal line network across the current volatility zone.

Grid Builder_v2
Indicator

Grid Builder_v2

This script projects a systematic horizontal price grid by calculating the local high and low extremes and populating equidistant levels based on a user-defined spacing interval.

grid yens
Indicator

grid yens

This indicator dynamically projects horizontal support and resistance levels across daily, weekly, and monthly horizons using high, low, and closing price calculations.

grid yens2
Indicator

grid yens2

This indicator dynamically renders daily, weekly, and monthly pivot levels alongside an expanded eight-tier weekly support and resistance array based on fixed price offsets.

grid yens3
Indicator

grid yens3

This indicator projects high-precision daily, weekly, and monthly pivot levels alongside extended symmetrical support and resistance zones based on historical price action.

grid yens4
Indicator

grid yens4

This indicator dynamically projects daily, weekly, and monthly pivot levels alongside specific fixed-increment arithmetic support and resistance zones.

Grid10
Indicator

Grid10

This indicator automatically calculates and renders a horizontal grid of dotted lines based on the price range visibility, scaling the resolution to the nearest power of ten for optimal human readability.

Grid_Builder
Indicator

Grid_Builder

This indicator projects a systematic horizontal coordinate framework across the current price action extremes to facilitate precise level visualization.

Indicator

Grid_v1_0

Indicator

Grid_v1_0_001

Indicator

Grid_v1_0_v1

grid_yens
Indicator

grid_yens

This indicator identifies the weekly opening price and projects equidistant horizontal support and resistance levels based on fixed pip increments.

grid_yens2
Indicator

grid_yens2

This indicator identifies the weekly opening price as a central pivot point and projects symmetrical linear zones to map out potential support and resistance levels.

grid_yens3
Indicator

grid_yens3

This indicator projects symmetrical horizontal support and resistance levels based on fixed point offsets from the weekly open price to identify structural expansion zones.

grid_yens4
Indicator

grid_yens4

This indicator identifies and plots a symmetrical series of horizontal support and resistance levels based on fixed point offsets from the weekly open price.

GroupOfHistory
Indicator

GroupOfHistory

This script parses historical trade data to cluster performance metrics, including profit, drawdown, and trade counts, into a structured CSV file based on specific criteria like magic numbers, symbols, or operation types.

gStdPivots
Indicator

gStdPivots

This indicator calculates and plots historical standard pivot points and resistance/support levels based on the previous day's high, low, and closing price dynamics.

gStdPivots_v1
Indicator

gStdPivots_v1

Calculates and projects multi-layer support and resistance levels based on daily price action highs, lows, and closing prices.

Indicator

Guppy MMA oscillator mtf

iMA
Guppy MMA oscillator
Indicator

Guppy MMA oscillator

iMA

This indicator calculates a weighted sum of multiple Exponential Moving Averages, differentiating short and long periods to quantify momentum polarity.

Guppy MMA oscillator_001
Indicator

Guppy MMA oscillator_001

iMA

This indicator quantifies market momentum by aggregating the weighted sum of short-term exponential moving averages against a subtracted long-term average to identify trend strength and exhaustion.

guppy34_alert
Indicator

guppy34_alert

iMA

The logic identifies bullish or bearish reversals by detecting instantaneous changes in the moving average's directional gradient.
Indicator

G_MACD_M1

iMACD
H - aligator - Clock
Indicator

H - aligator - Clock

Synchronizes and displays real-time timestamps across global financial hubs and local environments relative to the broker's offset.
HA-T3_Signal_AO_HA_TL_4H_Bars
Indicator

HA-T3_Signal_AO_HA_TL_4H_Bars

iAO

Identifies high-probability trend shifts by synchronizing Heiken Ashi price action, Awesome Oscillator momentum, and multi-timeframe TrendLord signals.

HA
Indicator

HA

This indicator transforms standard price action into smoothed synthetic candles by calculating mean-based open and close values to filter out market noise.

HAMA Lines
Indicator

HAMA Lines

iMA

This indicator synthesizes Moving Average components into a synthetic Heikin-Ashi structure to identify smoothed trend momentum and price boundaries.

Hans Indicator
Indicator

Hans Indicator

Identifies specific intraday price extremes from predefined time windows and projects expanded supply and demand zones to signal breakout entries.

Hans Indicator2
Indicator

Hans Indicator2

This indicator dynamically identifies and plots historical price boundaries from two specific time windows to signal breakout opportunities based on previous high/low extremes.

Hans Indicator3
Indicator

Hans Indicator3

Identifies high and low boundaries from specific time windows to project breakout zones for price action analysis.

Hans Indicator4
Indicator

Hans Indicator4

This indicator identifies and projects trading zones by calculating high/low extremes within specific time windows to detect momentum shifts and price breakouts.