Better_MA_H4
Download script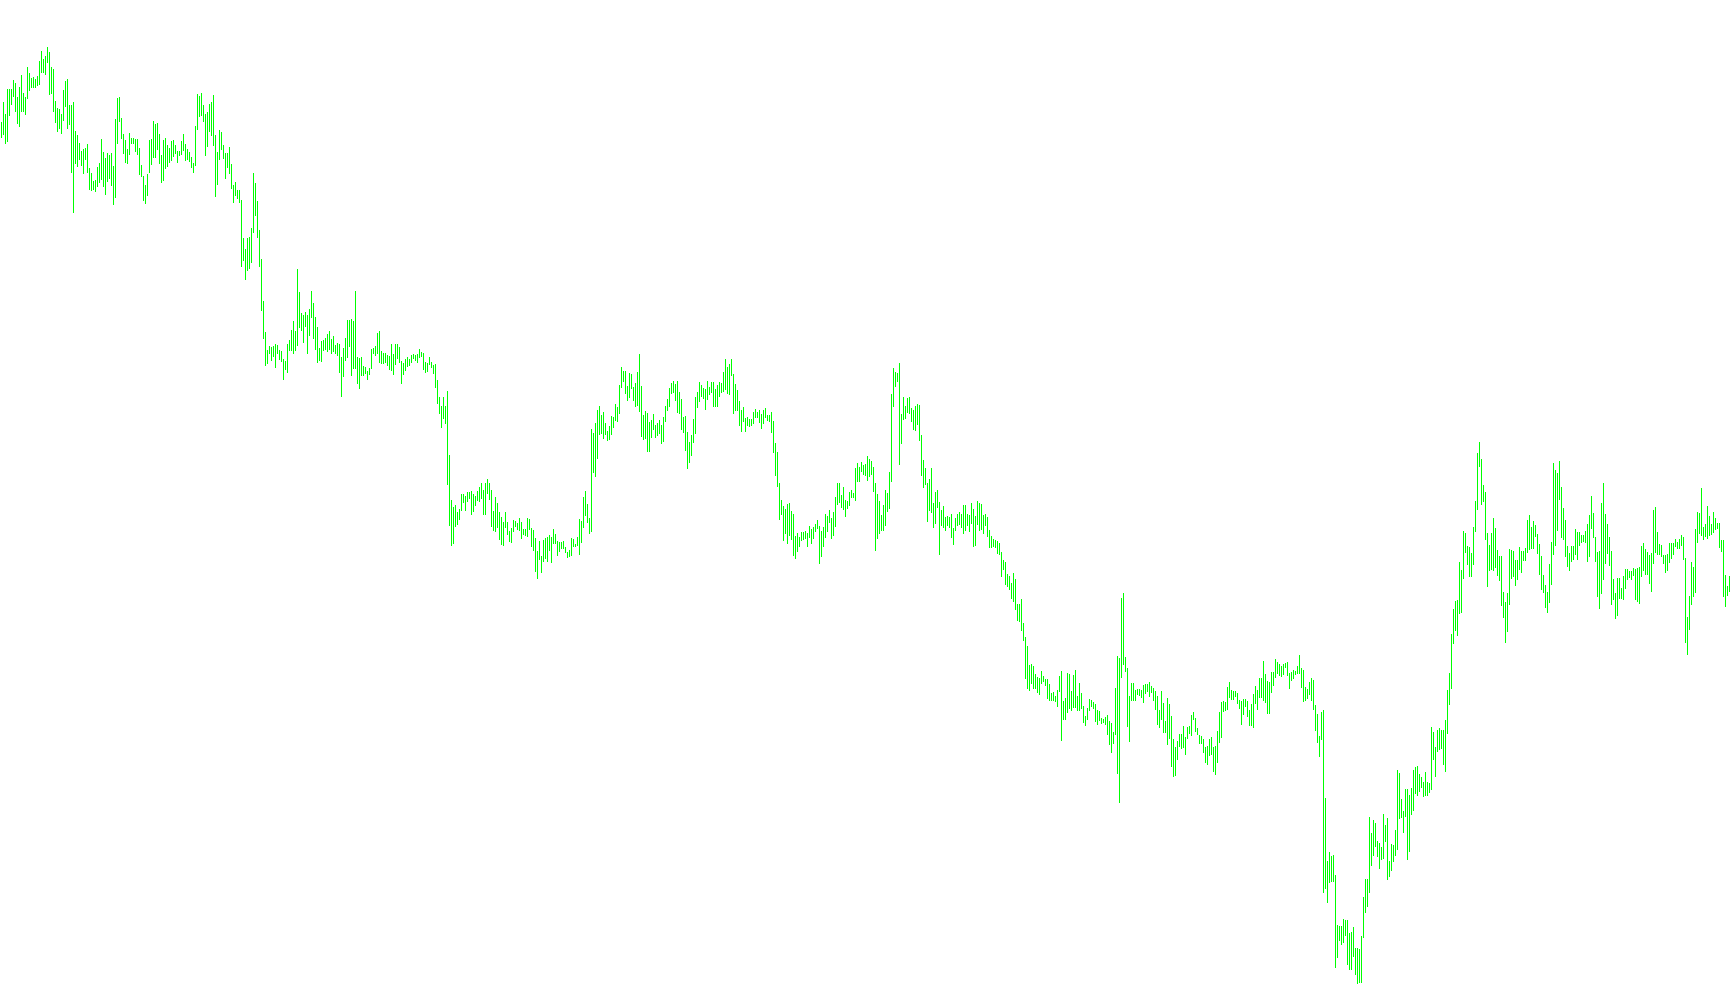
This script is a specialized technical analysis tool designed for the MetaTrader platform to help traders visualize historical price trends across multiple layers. Its primary function is to align and display three different Moving Average (MA) calculations simultaneously on a single separate window, allowing for a consolidated view of market momentum.
Core Logic and Functionality
Data Aggregation and Alignment The script works by looking back at a specific number of historical bars (defaulting to 500). Instead of simply showing the current price, it performs a "time-sync" operation. It takes the current time on your main chart and searches backward to find the corresponding data points on a higher timeframe (set by default to the 4-hour period). This ensures that even if you are viewing a small timeframe chart, the data displayed is normalized to a larger, more stable market cycle.
Multi-Layered Moving Averages The tool calculates three distinct Moving Averages using the Simple Moving Average (SMA) method based on closing prices. Each layer serves a different purpose by using a unique "look-back" period:
- The First Layer: Uses a short 5-period average to capture immediate, fast-moving price action.
- The Second Layer: Uses a medium 10-period average to identify mid-term trends.
- The Third Layer: Uses a longer 15-period average to highlight the broader, underlying market direction.
Visual Representation By plotting these three averages together—distinguished by different colors (Lime, Aqua, and White)—the script provides a visual "stack" of price data. Because they are mapped to the same time coordinates, a trader can observe how these three layers interact with one another.
Practical Purpose
For a user, this logic serves as a trend-smoothing mechanism. By observing whether the fast, medium, and long averages are moving in harmony or diverging, traders can get a clearer sense of market sentiment. The script removes the clutter of looking at three different charts or indicators separately, merging them into one cohesive visual stream that aligns perfectly with your current chart's timeline.
//+------------------------------------------------------------------+
//|                                                   Better_MA.mq4  |
//|                      Copyright © 2007, MetaQuotes Software Corp. |
//|                                        http://www.metaquotes.net |
//+------------------------------------------------------------------+
#property copyright "Copyright © 2007, MetaQuotes Software Corp."
#property link      "http://www.metaquotes.net"

#property indicator_separate_window
#property indicator_buffers 3
#property indicator_color1 Lime
#property indicator_color2 Aqua
#property indicator_color3 White


extern int NrBars=500;

string     Symbol1;
string     Symbol2;
string     Symbol3;
int        Period1= PERIOD_H4;

//---- buffers
double VolBuffer1[];
double VolBuffer2[];
double VolBuffer3[];
 double x1,x2,x3;

//+------------------------------------------------------------------+
//| Custom indicator initialization function                         |
//|------------------------------------------------------------------|

int init()
  {
/*
   if(StringFind(Symbol(),"m",0)>0)
   {
    Symbol1 = Symbol1+"m";
    Symbol2 = Symbol2+"m";
    Symbol3 = Symbol3+"m";
   }
*/

    Symbol1 = Symbol();
    Symbol2 = Symbol();
    Symbol3 = Symbol();

   IndicatorBuffers(3);

   SetIndexStyle(0,DRAW_LINE,0,1);
   SetIndexBuffer(0, VolBuffer1);
   SetIndexLabel(0,Symbol1+" "+Period1);
   SetIndexEmptyValue(0,EMPTY_VALUE);

   SetIndexStyle(1,DRAW_LINE,0,1);
   SetIndexBuffer(1, VolBuffer2);
   SetIndexLabel(1,Symbol2+" "+Period1);
   SetIndexEmptyValue(1,EMPTY_VALUE);

   SetIndexStyle(2,DRAW_LINE,0,1);
   SetIndexBuffer(2, VolBuffer3);
   SetIndexLabel(2,Symbol3+" "+Period1);
   SetIndexEmptyValue(2,EMPTY_VALUE);

   return(0);
  }


//+------------------------------------------------------------------+
//| Custor indicator deinitialization function                       |
//+------------------------------------------------------------------+
int deinit()
  {

  }

//+------------------------------------------------------------------+
//| Custom indicator iteration function                              |
//+------------------------------------------------------------------+
int start()
  {


  int pos=0;
  pos=NrBars;
  while(pos>=0)
  //while(pos<=NrBars)
     {

      int pos1 = iBarShift(Symbol1, Period1, iTime(NULL,0,pos), false);
	   x1=iMA(Symbol1,Period1,5,0,MODE_SMA,PRICE_CLOSE ,pos1);
		//if(x1==0)
		//  x1=EMPTY_VALUE;
		if (iTime(Symbol1, Period1, pos1) == iTime(NULL,0,pos))  // have to be sure the times match.
		{

		  VolBuffer1[pos]=x1;
		}
		else
		{
			VolBuffer1[pos]=x1;
		}

      int pos2 = iBarShift(Symbol2, Period1, iTime(NULL,0,pos), false);
      x2=iMA(Symbol2,Period1,10,0,MODE_SMA,PRICE_CLOSE ,pos2);
		//if(x2==0)
		//  x2=EMPTY_VALUE;
		if (iTime(Symbol2, Period1, pos2) == iTime(NULL,0,pos))  // have to be sure the times match.
		{
		 	 VolBuffer2[pos]=x2;
		}
		else
		{
			VolBuffer2[pos]=x2;
		}

      int pos3 = iBarShift(Symbol3, Period1, iTime(NULL,0,pos), false);
      x3=iMA(Symbol3,Period1,15,0,MODE_SMA,PRICE_CLOSE,pos3);
		//if(x3==0)
		//  x3=EMPTY_VALUE;
		if (iTime(Symbol3, Period1, pos3) == iTime(NULL,0,pos))  // have to be sure the times match.
		{
		 	 VolBuffer3[pos]=x3;
		}
		else
		{
			VolBuffer3[pos]=x3;
		}

 	   //pos++;
 	   pos--;
     }


   return(0);
  }
//+------------------------------------------------------------------+
Comments