bollinger band ema
Download script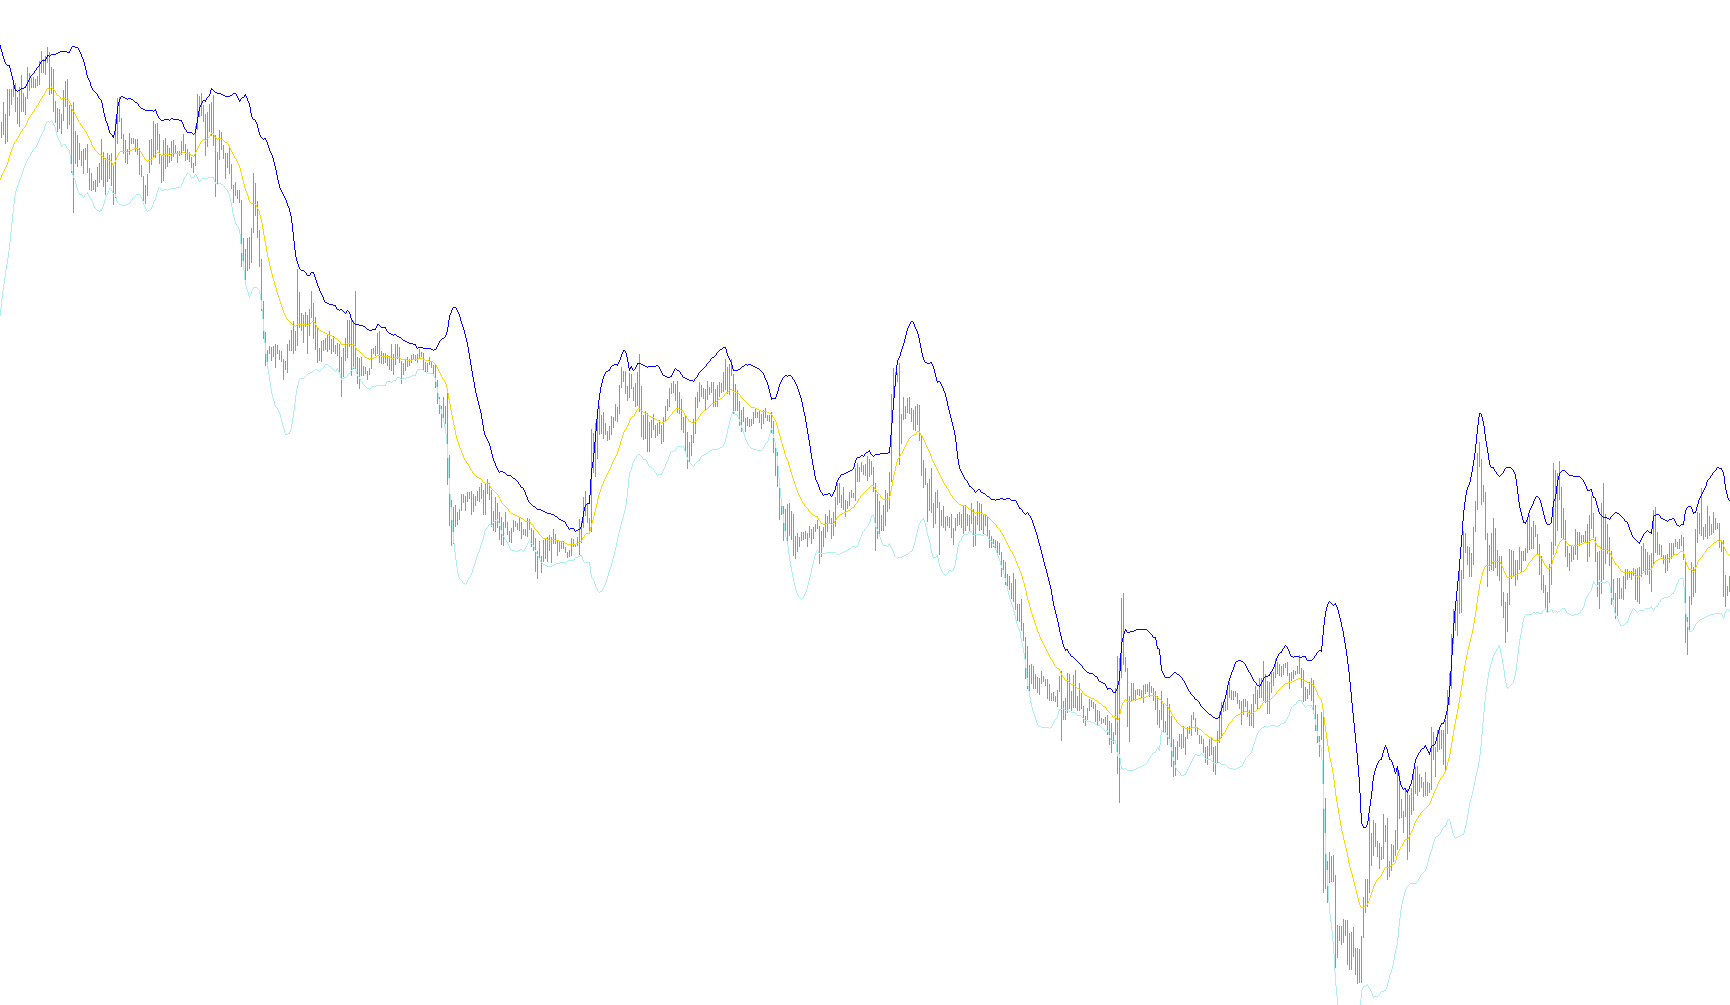
This script is designed to function as a visual trading tool that helps identify price trends and potential overextended market conditions. It generates three distinct lines on your trading chart, which together form a set of "Bands" surrounding the current market price.
Core Logic Overview
The tool operates by analyzing historical price data to create a dynamic corridor. Here is how it processes that information:
1. The Central Baseline (Moving Average) The script first calculates a central moving average based on a specific number of past candles (defined by the period). This line represents the "average" price over that time frame, smoothing out minor fluctuations to show the broader direction of the market.
2. Measuring Volatility (Standard Deviation) To determine how wide the outer bands should be, the script measures volatility. It looks at how much the price has deviated from the central moving average over the chosen period. If the market is swinging wildly, the bands will expand; if the market is trading calmly, the bands will contract.
3. Creating the Upper and Lower Boundaries The script then projects two outer lines based on a user-defined multiplier:
- The Upper Band: This is calculated by taking the central average and adding the volatility measurement to it.
- The Lower Band: This is calculated by taking the central average and subtracting the volatility measurement from it.
How to Interpret the Results
By plotting these three lines, the script creates a visual "envelope" for the price:
- Trend Identification: When the price stays consistently between the bands and follows the direction of the middle line, it indicates a steady trend.
- Overextended Markets: When the price touches or pushes beyond the upper or lower bands, it often suggests that the market is moving significantly further than usual in one direction, which can sometimes signal that the price is becoming "stretched" and may soon pull back toward the center.
//+------------------------------------------------------------------+
//| Bands.mq4 |
//| Copyright c 2005, MetaQuotes Software Corp. |
//| http://www.metaquotes.net/ |
//+------------------------------------------------------------------+
#property copyright "Copyright c 2005, MetaQuotes Software Corp."
#property link "http://www.metaquotes.net/"

#property indicator_chart_window
#property indicator_buffers 3
#property indicator_color1 LightSeaGreen
#property indicator_color2 LightSeaGreen
#property indicator_color3 LightSeaGreen
//---- indicator parameters
extern int BandsPeriod=20;
extern int BandsShift=0;
extern double BandsDeviations=2.0;
//---- buffers
double MovingBuffer[];
double UpperBuffer[];
double LowerBuffer[];
//+------------------------------------------------------------------+
//| Custom indicator initialization function |
//+------------------------------------------------------------------+
int init()
{
//---- indicators
SetIndexStyle(0,DRAW_LINE);
SetIndexBuffer(0,MovingBuffer);
SetIndexStyle(1,DRAW_LINE);
SetIndexBuffer(1,UpperBuffer);
SetIndexStyle(2,DRAW_LINE);
SetIndexBuffer(2,LowerBuffer);
//----
SetIndexDrawBegin(0,BandsPeriod+BandsShift);
SetIndexDrawBegin(1,BandsPeriod+BandsShift);
SetIndexDrawBegin(2,BandsPeriod+BandsShift);
//----
return(0);
}
//+------------------------------------------------------------------+
//| Bollinger Bands |
//+------------------------------------------------------------------+
int start()
{
int i,k,counted_bars=IndicatorCounted();
double deviation;
double sum,oldval,newres;
//----
if(Bars<=BandsPeriod) return(0);
//---- initial zero
if(counted_bars<1)
for(i=1;i<=BandsPeriod;i++)
{
MovingBuffer[Bars-i]=EMPTY_VALUE;
UpperBuffer[Bars-i]=EMPTY_VALUE;
LowerBuffer[Bars-i]=EMPTY_VALUE;
}
//----
int limit=Bars-counted_bars;
if(counted_bars>0) limit++;
for(i=0; i<limit; i++)
MovingBuffer[i]=iMA(NULL,0,BandsPeriod,BandsShift,MODE_EMA,PRICE_CLOSE,i);
//----
i=Bars-BandsPeriod+1;
if(counted_bars>BandsPeriod-1) i=Bars-counted_bars-1;
while(i>=0)
{
sum=0.0;
k=i+BandsPeriod-1;
oldval=MovingBuffer[i];
while(k>=i)
{
newres=Close[k]-oldval;
sum+=newres*newres;
k--;
}
deviation=BandsDeviations*MathSqrt(sum/BandsPeriod);
UpperBuffer[i]=oldval+deviation;
LowerBuffer[i]=oldval-deviation;
i--;
}
//----
return(0);
}
//+------------------------------------------------------------------+
Comments