ATR_x2
Download script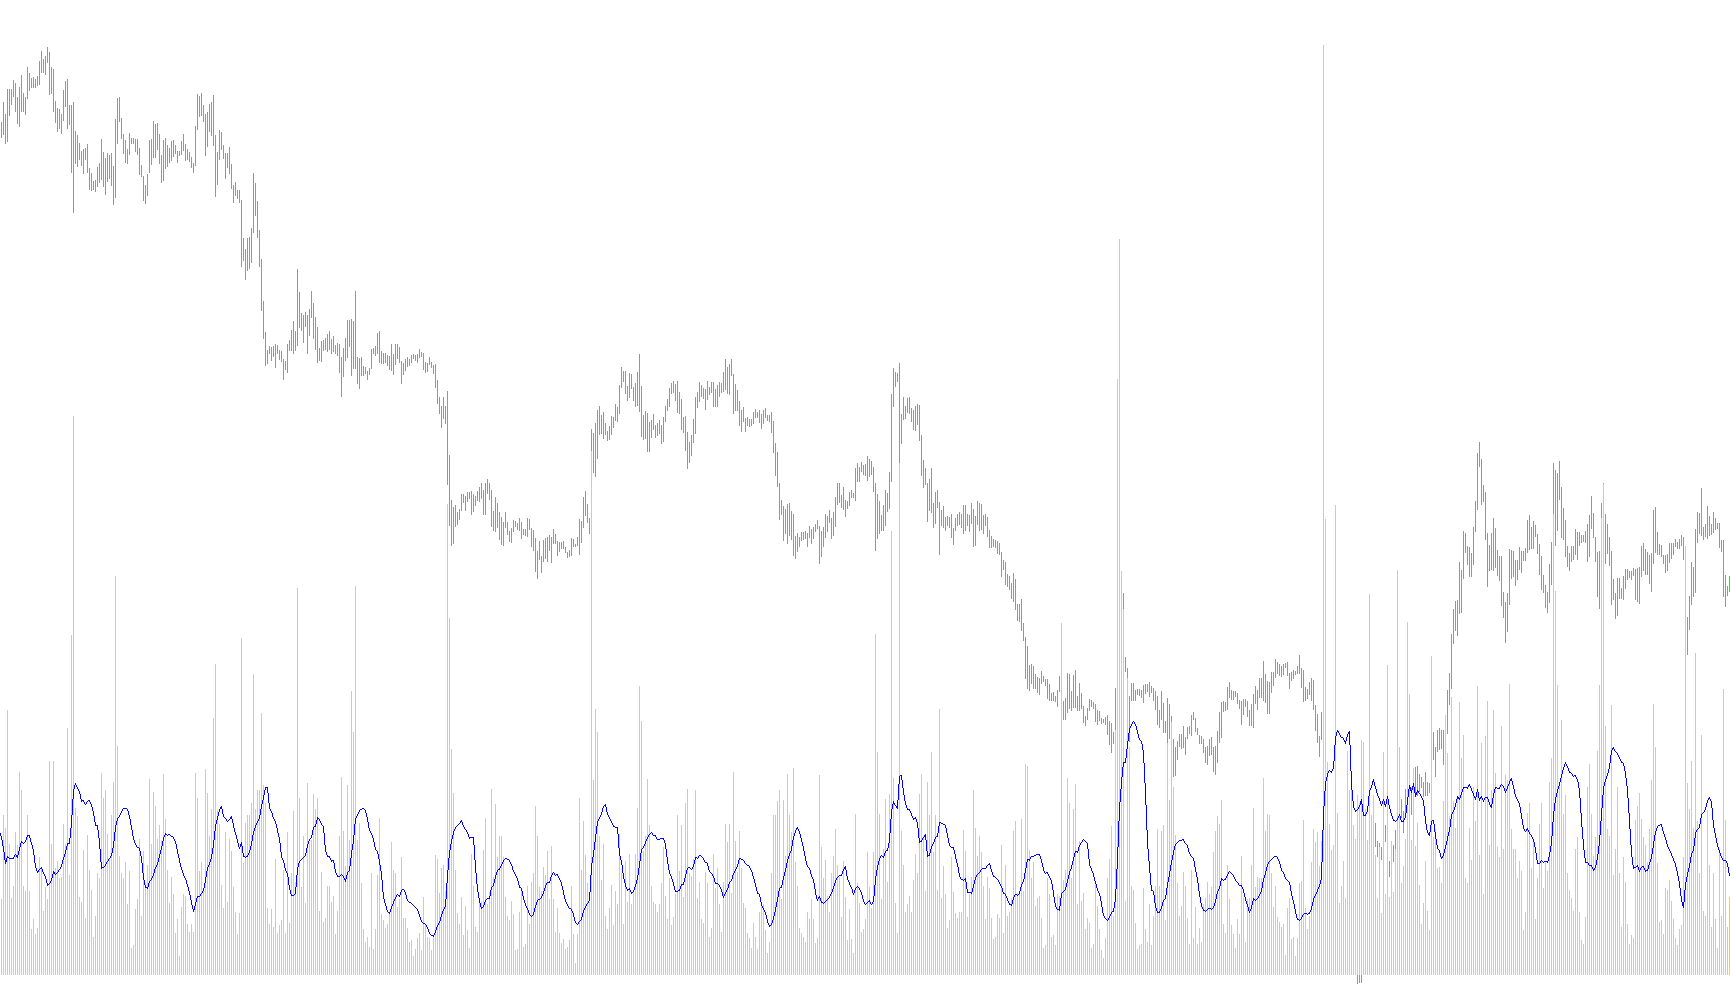
This technical tool is designed to provide traders with a clear visual representation of market volatility. Instead of showing price movements directly, it calculates the "True Range"—a measure of how much an asset's price fluctuates during a specific timeframe.
How the Logic Works
1. Measuring Price Movement (The True Range) The script looks at each individual candle on your chart to determine its size. To ensure accuracy, it doesn't just look at the distance between the highest and lowest points of a single candle. It also considers the price gap between the previous candle's closing price and the current candle's range. This "True Range" captures more information than standard price action because it accounts for "gaps" (periods where the market jumps from one price to another without trading in between).
2. Processing the Data The tool performs two distinct operations to refine this data into a usable format:
- Data Collection: It first calculates the range for every candle across the chart history, storing these values as raw data points.
- Smoothing: Because raw market volatility can be "noisy" or erratic (jumping up and down very quickly), the script applies a Moving Average to those ranges. This smooths out the spikes, creating a fluid line that represents the average intensity of the market over a set period.
3. Customization and Display The logic is built around a user-defined "Period" (defaulting to 14). This tells the script how many previous candles to look back at when calculating the average.
- Visual Output: The results are displayed in a separate window below your main price chart.
- The Histogram vs. Line: It utilizes two visual styles: a histogram (vertical bars) and a line. The histogram helps identify the specific magnitude of volatility for each period, while the line helps you see the broader trend of market activity over time.
Practical Application
By using this logic, a user can quickly identify periods of high and low "activity." When the indicator rises, it signals that the market is becoming more volatile (larger price swings); when it falls, it indicates that the market is stabilizing or moving with less intensity. This helps in determining whether the current market environment is suitable for aggressive trading or if it requires a more conservative approach.
//+------------------------------------------------------------------+
//|                                                          ATR.mq4 |
//|                      Copyright © 2005, MetaQuotes Software Corp. |
//|                                       http://www.metaquotes.net/ |
//+------------------------------------------------------------------+
#property copyright "Copyright © 2005, MetaQuotes Software Corp."
#property link      "http://www.metaquotes.net/"

#property indicator_separate_window
#property indicator_buffers 2
#property indicator_color1 RoyalBlue
#property indicator_color2 DeepSkyBlue
#property indicator_level1 0.001
#property indicator_levelcolor  SlateGray
//---- input parameters
extern int AtrPeriod=14;
//---- buffers
double AtrBuffer[];
double TempBuffer[];
//+------------------------------------------------------------------+
//| Custom indicator initialization function                         |
//+------------------------------------------------------------------+
int init()
  {
   string short_name;
//---- 1 additional buffer used for counting.
   IndicatorBuffers(3);
//---- indicator line
   SetIndexStyle (1,DRAW_LINE);
   SetIndexBuffer(1,AtrBuffer);
   SetIndexBuffer(0,TempBuffer);
   SetIndexStyle (0,DRAW_HISTOGRAM);
//---- name for DataWindow and indicator subwindow label
   short_name="ATR_("+AtrPeriod+")";
   IndicatorShortName(short_name);
   SetIndexLabel(0,short_name);
   SetIndexLabel(1,short_name);

//----
   SetIndexDrawBegin(0,AtrPeriod);
   SetIndexDrawBegin(1,AtrPeriod);

//----
   return(0);
  }
//+------------------------------------------------------------------+
//| Average True Range                                               |
//+------------------------------------------------------------------+
int start()
  {
   int i,counted_bars=IndicatorCounted();
//----
   if(Bars<=AtrPeriod) return(0);
//---- initial zero
   if(counted_bars<1)
      for(i=1;i<=AtrPeriod;i++)
      AtrBuffer[Bars-i]=0.0;
//----
   i=Bars-counted_bars-1;
   while(i>=0)
     {
      double high=High[i];
      double low =Low[i];
      if(i==Bars-1) TempBuffer[i]=high-low;
      else
        {
         double prevclose=Close[i+1];
         TempBuffer[i]=MathMax(high,prevclose)-MathMin(low,prevclose);
        }
      i--;
     }
//----
   if(counted_bars>0) counted_bars--;
   int limit=Bars-counted_bars;
   for(i=0; i<limit; i++)
      AtrBuffer[i]=iMAOnArray(TempBuffer,Bars,AtrPeriod,0,MODE_SMA,i);
//----
   return(0);
  }
//+------------------------------------------------------------------+
Comments