This script calculates and displays two different versions of the Average True Range (ATR) indicator on a chart. The ATR is a technical indicator that measures market volatility. Here's a breakdown of what the script does, explained in plain language:
1. Setup and Configuration:
- Indicator Name: The script defines a short name for the indicator that will appear on the chart, including the ATR periods used and the timeframe.
- Timeframe Selection: The script allows the user to choose a timeframe for the ATR calculation. It provides a list of predefined timeframes (M1, M5, M15, M30, H1, H4, D1, W1, MN). If the user doesn't specify a timeframe, it defaults to the chart's current timeframe.
- ATR Periods: The script allows the user to specify two different periods (lengths of time) for calculating the ATR. These are referred to as
AtrPeriod1andAtrPeriod2. Different periods will result in different ATR values. - Visual Appearance: The script sets the color and style (line or histogram) for how the ATR values will be displayed on the chart.
2. Calculating the Average True Range (ATR):
iATR()Function: The core of the script uses a built-in function callediATR(). This function calculates the Average True Range for a given timeframe and period. The "True Range" itself is a calculation that considers the highest, lowest, and closing prices of a period to determine the largest range of price movement. The ATR is then the average of these True Range values over the specified period.- Two ATR Calculations: The script calculates two separate ATR values: one using
AtrPeriod1and another usingAtrPeriod2. This allows the user to compare ATR values calculated with different periods. - Data Retrieval: The script retrieves historical price data (time and price) from the chart to perform the ATR calculations.
3. Displaying the Results:
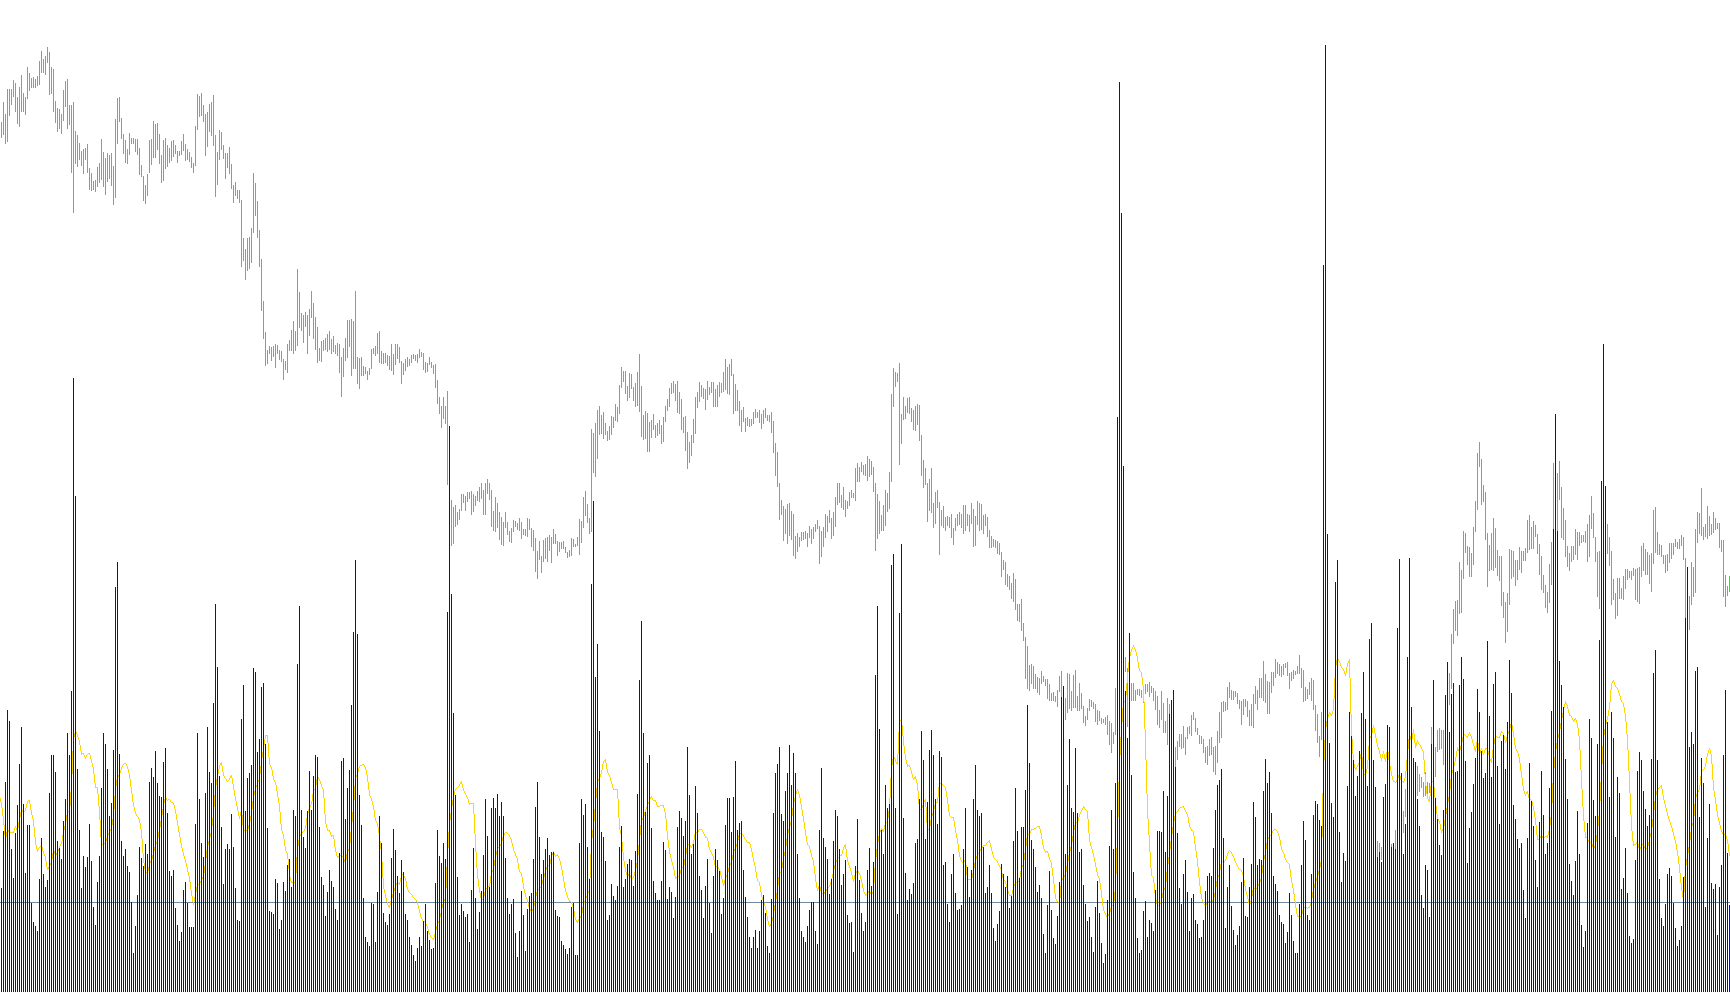
- Two Lines/Histograms: The script displays the two calculated ATR values as separate lines or histograms on the chart. Each ATR value is labeled with its period and timeframe.
- Chart Integration: The calculated ATR values are integrated into the chart, allowing the user to visually assess volatility levels.
In essence, this script provides a flexible tool for analyzing market volatility by calculating and displaying two different versions of the Average True Range indicator, allowing for comparison and a more nuanced understanding of price fluctuations.
Indicators Used
12
Views
0
Downloads
0
Favorites
ATR_x2LHist_mtf
//+------------------------------------------------------------------+
//|                                                          ATR.mq4 |
//|                      Copyright © 2005, MetaQuotes Software Corp. |
//|atr x2                                 http://www.metaquotes.net/ |
//+------------------------------------------------------------------+
//2008fxtsd   mtf keris f-la

#property copyright "Copyright © 2005, MetaQuotes Software Corp."
#property link      "http://www.metaquotes.net/"

#property indicator_separate_window
#property indicator_buffers 2
#property indicator_color1 DeepSkyBlue
#property indicator_color2 RoyalBlue
#property indicator_width1 1
#property indicator_width2 1

#property indicator_level1 0.001
#property indicator_levelcolor  SlateGray
//---- input parameters
extern int AtrPeriod1=2;
extern int AtrPeriod2=14;


extern int TimeFrame=0;
extern string TimeFrames = "M1;5,15,30,60H1;240H4;1440D1;10080W1;43200MN";

//---- buffers
double AtrBuffer1[];
double AtrBuffer2[];
//+------------------------------------------------------------------+
//| Custom indicator initialization function                         |
//+------------------------------------------------------------------+
int init()
  {

//   IndicatorBuffers(3);
//---- indicator line
   SetIndexStyle (0,DRAW_LINE);
   SetIndexStyle (1,DRAW_HISTOGRAM);
   SetIndexBuffer(0,AtrBuffer2);
   SetIndexBuffer(1,AtrBuffer1);


//---- name for DataWindow and indicator subwindow label

   TimeFrame = MathMax (TimeFrame,Period());

   switch(TimeFrame)
   {
      case 1 : string TimeFrameStr="M1"; break;
      case 5 : TimeFrameStr="M5"; break;
      case 15 : TimeFrameStr="M15"; break;
      case 30 : TimeFrameStr="M30"; break;
      case 60 : TimeFrameStr="H1"; break;
      case 240 : TimeFrameStr="H4"; break;
      case 1440 : TimeFrameStr="D1"; break;
      case 10080 : TimeFrameStr="W1"; break;
      case 43200 : TimeFrameStr="MN"; break;
      default : TimeFrameStr="TF0";
   }

   string short_name;
   short_name="ATR_("+AtrPeriod1+","+AtrPeriod2+") ["+TimeFrameStr+"] ";
   IndicatorShortName(short_name);

   SetIndexLabel(0,"ATR1 "+short_name);
   SetIndexLabel(1,"ATR2 "+short_name);

   SetIndexDrawBegin(0,AtrPeriod2);
   SetIndexDrawBegin(1,AtrPeriod1);

//----
   return(0);
  }
//+------------------------------------------------------------------+
//| Average True Range                                               |
//+------------------------------------------------------------------+
int start()
  {
   datetime TimeArray[];
   int    i,shift,limit,y,counted_bars=IndicatorCounted();

   if(counted_bars<0) return(-1);
   if(counted_bars>0) counted_bars--;

   ArrayCopySeries(TimeArray,MODE_TIME,Symbol(),TimeFrame);

   limit=Bars-counted_bars;
   limit = MathMax (limit,TimeFrame/Period());

   for(i=0,y=0;i<limit;i++)
   {
   if (Time[i]<TimeArray[y]) y++;


     AtrBuffer1[i]=iATR(NULL,TimeFrame,AtrPeriod1,y) ;
     AtrBuffer2[i]=iATR(NULL,TimeFrame,AtrPeriod2,y);
   }

   return(0);
  }
//+---
Comments