ATR_SL_CHANEL
Download script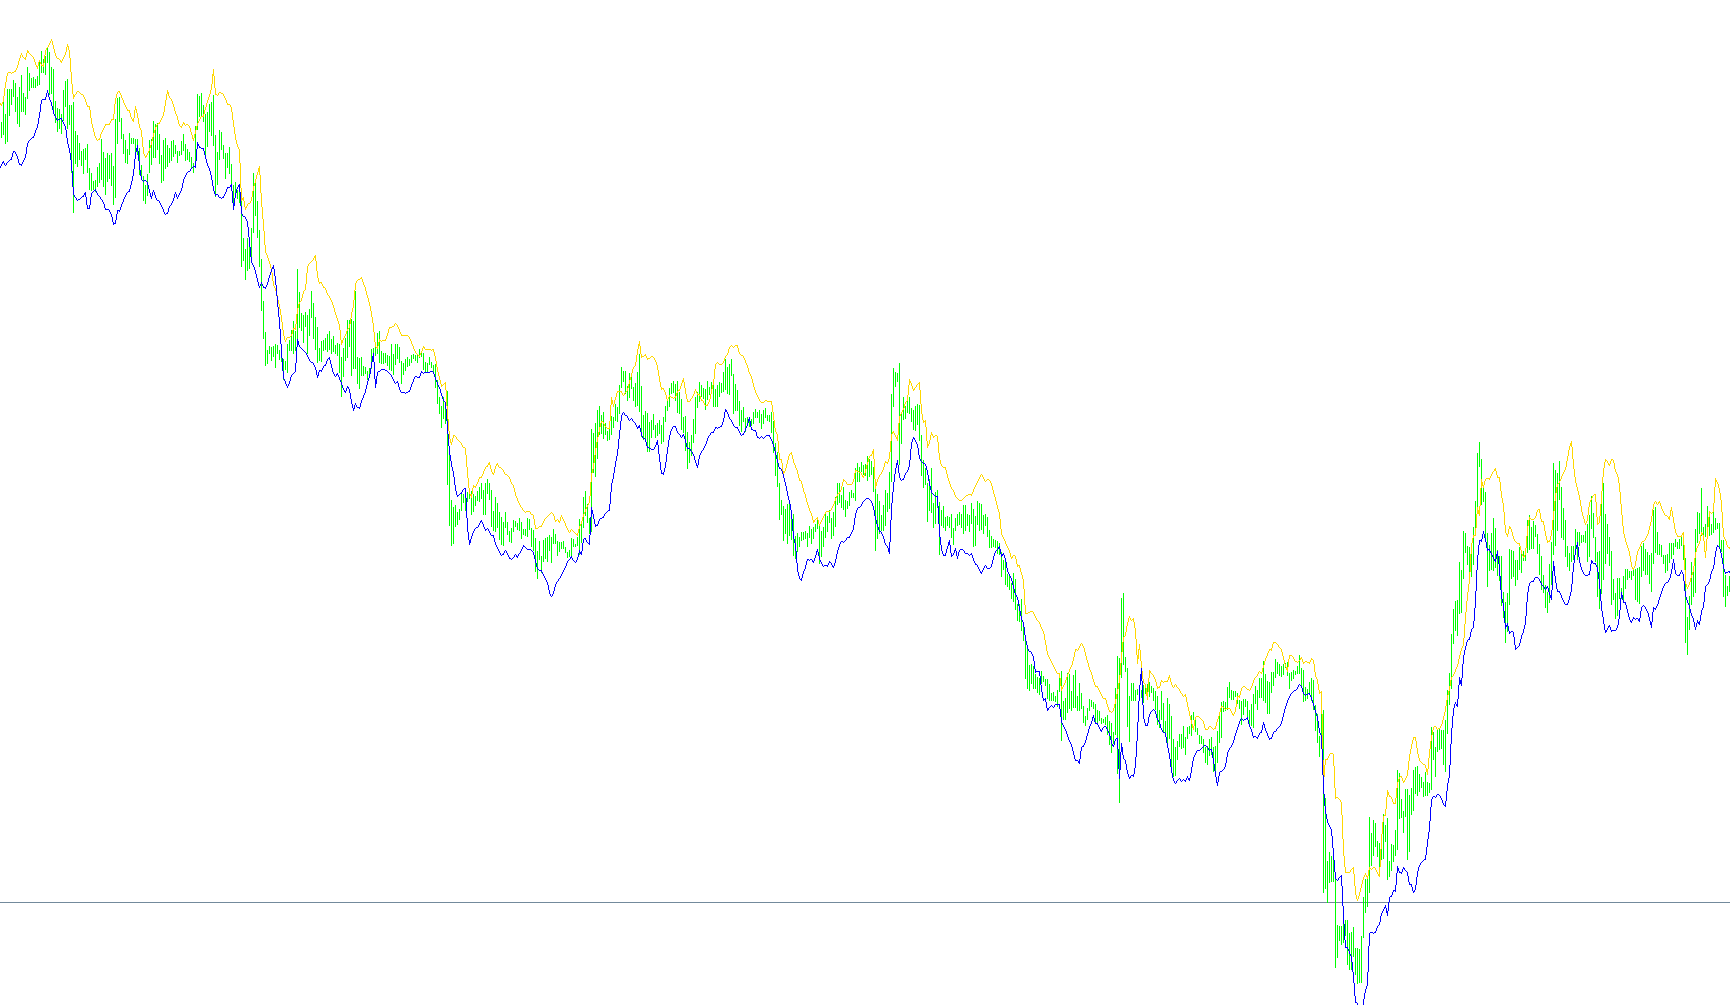
This script functions as a dynamic visual tool for traders to identify potential support and resistance zones on a price chart. It automatically calculates two distinct boundary lines—one representing an upper ceiling and the other a lower floor—based on recent market volatility and price action.
How the Logic Works
The core purpose of this tool is to help traders visualize "buffer zones" where price might react or reverse. Instead of using static horizontal lines, it creates moving boundaries that adjust automatically as the market changes. Here is the breakdown of how it determines these levels:
1. Measuring Recent Extremes The script looks back at the last 10 candles on the chart to find the highest and lowest points reached during that period. By focusing on this specific window, the tool ensures that the boundaries are relevant to current market behavior rather than outdated historical data.
2. Factoring in Volatility (The ATR Component) To ensure the boundaries aren't too tight or too loose, the script incorporates a volatility measurement known as the Average True Range (ATR). This measures how much the price typically moves up and down.
- The tool takes this average move and multiplies it by a specific "Factor" (which can be adjusted by the user).
- A higher factor creates wider boundaries, while a lower factor creates tighter ones.
3. Constructing the Boundaries Using the data above, the script draws two lines:
- The Lower Boundary (Green): This is calculated by taking the lowest price point from the recent window and adding the volatility buffer to it. This represents a "floor" where price might find support.
- The Upper Boundary (Red): This is calculated by taking the highest price point from the recent window and subtracting the volatility buffer from it. This represents a "ceiling" where price might face resistance.
Summary for Traders
In essence, this script creates a "channel" of activity. Rather than predicting the exact price at which a trend will flip, it provides a visual guide of the area where significant price action is likely to occur based on recent highs, lows, and the current intensity of market swings.
//+------------------------------------------------------------------+
//|                                                ATR_SL_CHANEL.mq4 |
//|                                                          Kalenzo |
//|                                                  simone@konto.pl |
//+------------------------------------------------------------------+
#property copyright "Kalenzo"
#property link      "simone@konto.pl"

#property indicator_chart_window
#property indicator_buffers 2
#property indicator_color1 Red
#property indicator_color2 Green
double up[],dn[];
extern int ATR_FACTOR = 3;
//+------------------------------------------------------------------+
//| Custom indicator initialization function                         |
//+------------------------------------------------------------------+
int init()
  {
//---- indicators
    SetIndexStyle(0,DRAW_LINE,0,1);
    SetIndexBuffer(0,up);
    SetIndexStyle(1,DRAW_LINE,0,1);
    SetIndexBuffer(1,dn);
//----
   return(0);
  }
//+------------------------------------------------------------------+
//| Custor indicator deinitialization function                       |
//+------------------------------------------------------------------+
int deinit()
  {
//----

//----
   return(0);
  }
//+------------------------------------------------------------------+
//| Custom indicator iteration function                              |
//+------------------------------------------------------------------+
int start()
  {

//----
   int limit;
   int counted_bars=IndicatorCounted();
   if(counted_bars<0) counted_bars=0;
   if(counted_bars>0) counted_bars--;
   limit=Bars-counted_bars;

   for(int i=0;i<limit;i++)
   {
      dn[i] = High[Highest(Symbol(),0,MODE_HIGH,10,i)] - (ATR_FACTOR*iATR(Symbol(),0,10,i));
      up[i] = Low[Lowest(Symbol(),0,MODE_LOW,10,i)] + (ATR_FACTOR*iATR(Symbol(),0,10,i));
   }
//----
   return(0);
  }
//+------------------------------------------------------------------+
Comments