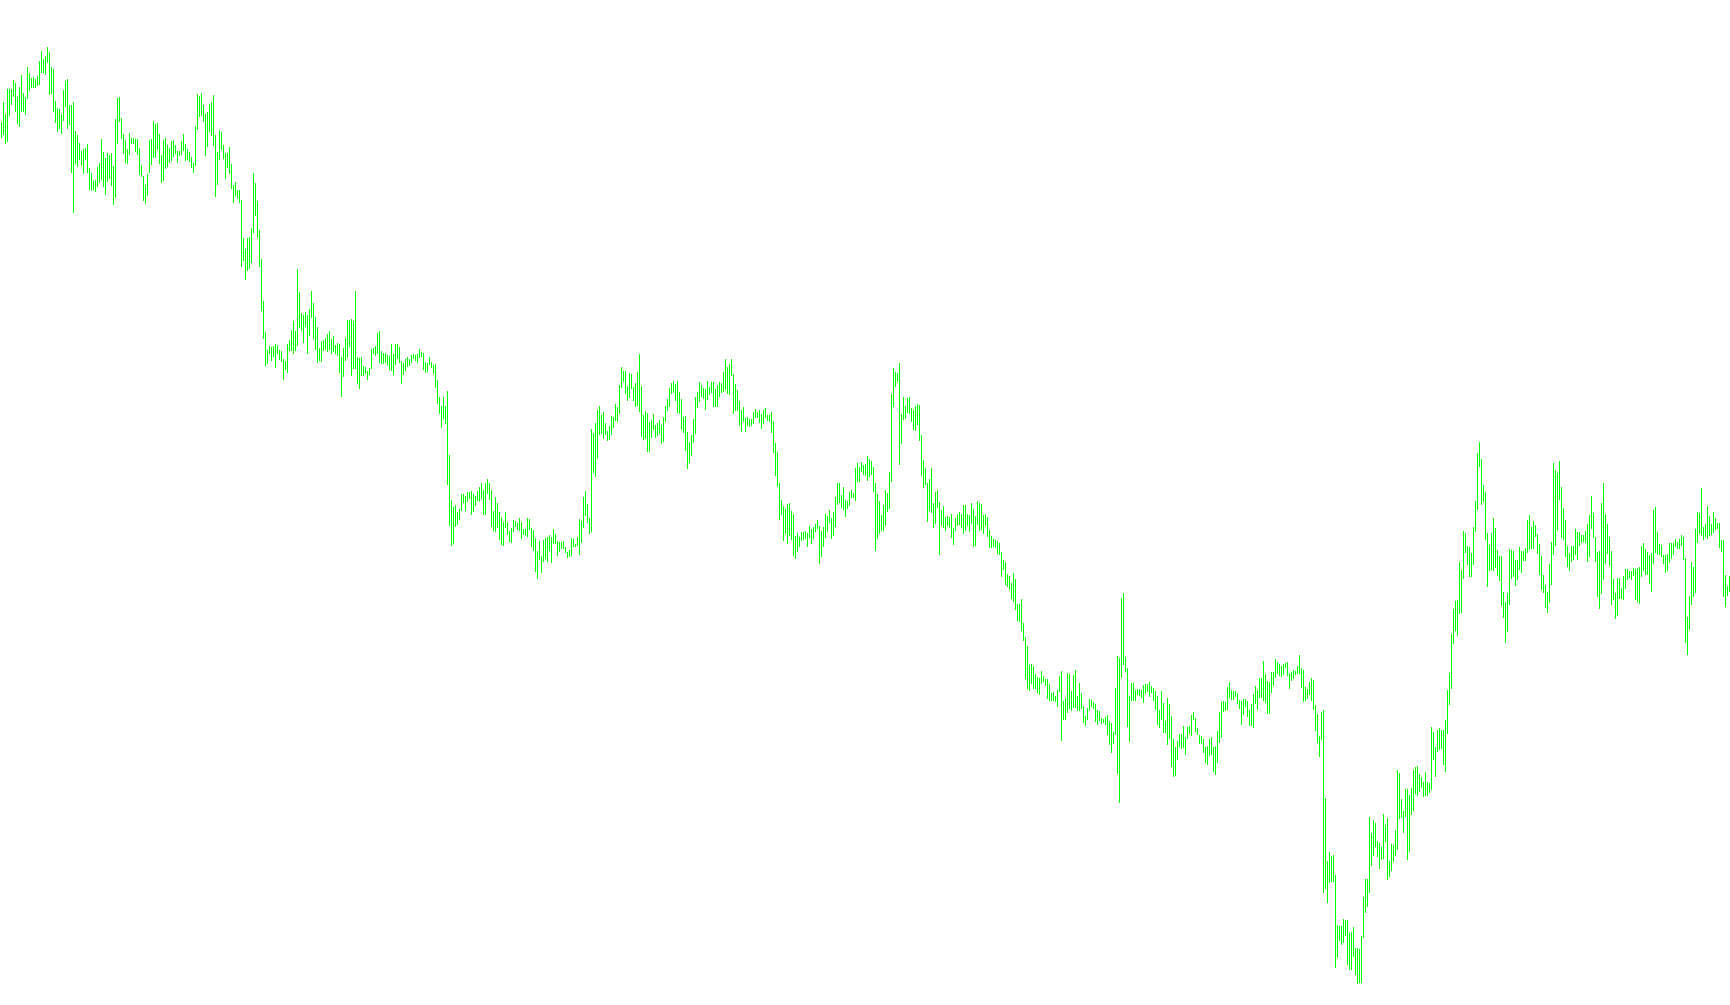
This technical script is designed to analyze and visualize price trends on a trading chart by identifying a "central" smoothed trend line and establishing a boundary zone around it. It functions as a specialized smoothing tool that attempts to filter out market noise to show the underlying direction of price movement.
Core Analytical Logic
The logic operates in three distinct phases to arrive at the final visual output:
1. Data Sampling and Alignment The script begins by looking back at historical price data. It establishes specific "anchor points" based on a user-defined timeframe (hours). Instead of just looking at the current price, it selects key historical prices to act as the foundation for its calculations, ensuring that the resulting trend is based on significant milestones rather than minor fluctuations.
2. Iterative Smoothing and Interpolation The script performs a complex mathematical smoothing process:
- Mean Calculation: It calculates averages between multiple data points to create a smoother transition from one price point to another.
- Linear Interpolation: To ensure the trend line looks continuous and fluid rather than jagged, the script uses a mathematical technique to "fill in the blanks" between the anchor points. This creates a bridge across the time intervals, resulting in a smooth, curved path that represents the primary price flow.
3. Envelope Generation Once the central smoothed trend (the core "at_Itp(t)" line) is established, the script applies an "Envelope" logic:
- Upper Boundary: It projects a line above the central trend by a specific percentage.
- Lower Boundary: It projects a line below the central trend by that same percentage.
Visual Interpretation for Traders
The final result on your chart consists of three distinct lines:
- The Central Line: Represents the "fair value" or smoothed average of the current price movement.
- The Upper and Lower Envelopes: These create a visual corridor. When the price moves outside these boundaries, it may indicate that the market is overextended (overbought or oversold) relative to its recent smoothed trend. When the price stays within these lines, it suggests the market is following the established trend established by the central line.
By adjusting settings like the hours (lookback depth), s (smoothing iterations), and Envelope_Shift (the width of the corridor), users can customize how sensitive or "tight" these trend boundaries appear on different types of financial instruments.
//+------------------------------------------------------------------+
//|                                                 at_Itp(t)Env.mq4 |
//|        at_Itp(t):    Copyright © 2005, MetaQuotes Software Corp. |
//|                                        http://www.metaquotes.net |
//|        Envelope:              Copyright © 2005, Nikolay Kositsin |
//+------------------------------------------------------------------+
#property copyright "Copyright © 2005, MetaQuotes Software Corp."
#property link      "http://www.metaquotes.net"
//----
#property indicator_chart_window
#property indicator_buffers 3
#property indicator_color1 Lime
#property indicator_color2 Blue
#property indicator_color3 Red
//----
extern int hours=4;
extern int s=10;
extern int cb=1000;
extern double Envelope_Shift=0.20;
extern int Shift=0;
double ci[];
double UperBuffer [];
double DownBuffer [];
//+------------------------------------------------------------------+
//|                                                                  |
//+------------------------------------------------------------------+
int init()
  {
//---- drawing settings
   SetIndexStyle(0,DRAW_LINE);
   SetIndexStyle(1,DRAW_LINE);
   SetIndexStyle(2,DRAW_LINE);
//---- IndexShift
   SetIndexShift(0,Shift);
   SetIndexShift(1,Shift);
   SetIndexShift(2,Shift);
//----
   IndicatorDigits(MarketInfo(Symbol(),MODE_DIGITS));
//----
   SetIndexLabel (0, "Envelope+");
   SetIndexLabel (1, "at_Itp(t)");
   SetIndexLabel (2, "Envelope-");
//---- indicator buffers
   IndicatorBuffers(3);
//---- indicator buffers mapping
   SetIndexBuffer (0, UperBuffer);
   SetIndexBuffer (1, ci);
   SetIndexBuffer (2, DownBuffer);
//----
   return(0);
  }
//+------------------------------------------------------------------+
//|                                                                  |
//+------------------------------------------------------------------+
int start()
  {
   //   int    counted_bars=IndicatorCounted();
   int i,x,m,pt,aa,bb,cc;
//----------------------------
   pt=hours*60/Period();
//-----------------------
   for(m=0; m<=s; m++)
     {
      i=0;
      while(i<=cb)
        {
         if (m==0) { ci[cb+pt]=Close[cb+pt]; ci[i]=Close[i]; ci[cb+2*pt]=Close[cb+2*pt];}
         if (m!=0 & m!=s) { ci[i+pt]=0.5*(ci[i]+ci[i+2*pt]); ci[0]=0.5*(ci[0]+ci[pt]);  ci[cb+2*pt]=0.5*(ci[cb+2*pt]+ci[cb+pt]); }
           if (m==s) { aa=i; bb=i+pt; cc=i+2*pt;
            for(x=i; x<=i+pt-1; x++)  {ci[x]=ci[aa]*((x-bb)*(x-cc))/((aa-bb)*(aa-cc))+ci[bb]*((x-aa)*(x-cc))/((bb-aa)*(bb-cc))+ci[cc]*((x-aa)*(x-bb))/((cc-aa)*(cc-bb));}
           }

         i=i+pt;
        }
     }
   //+------------------------------------------------------------------+
   //|                                                                  |
   //| Input indicator buffer: ci.                                      |
   //| Output indicator buffers: UperBuffer, DownBuffer.                |
   //+------------------------------------------------------------------+                                                                                                     |
   int ExtCountedBars=IndicatorCounted();
   int r;   r=Bars-ExtCountedBars-1;
   while(r>=0)
     {
      UperBuffer[r]=  ci[r]*(1+Envelope_Shift/100);
      DownBuffer[r]=  ci[r]/(1+Envelope_Shift/100);
      r--;
     }
   return(0);
  }
//+------------------------------------------------------------------+
Comments