ATM_HiLoXTF
Download script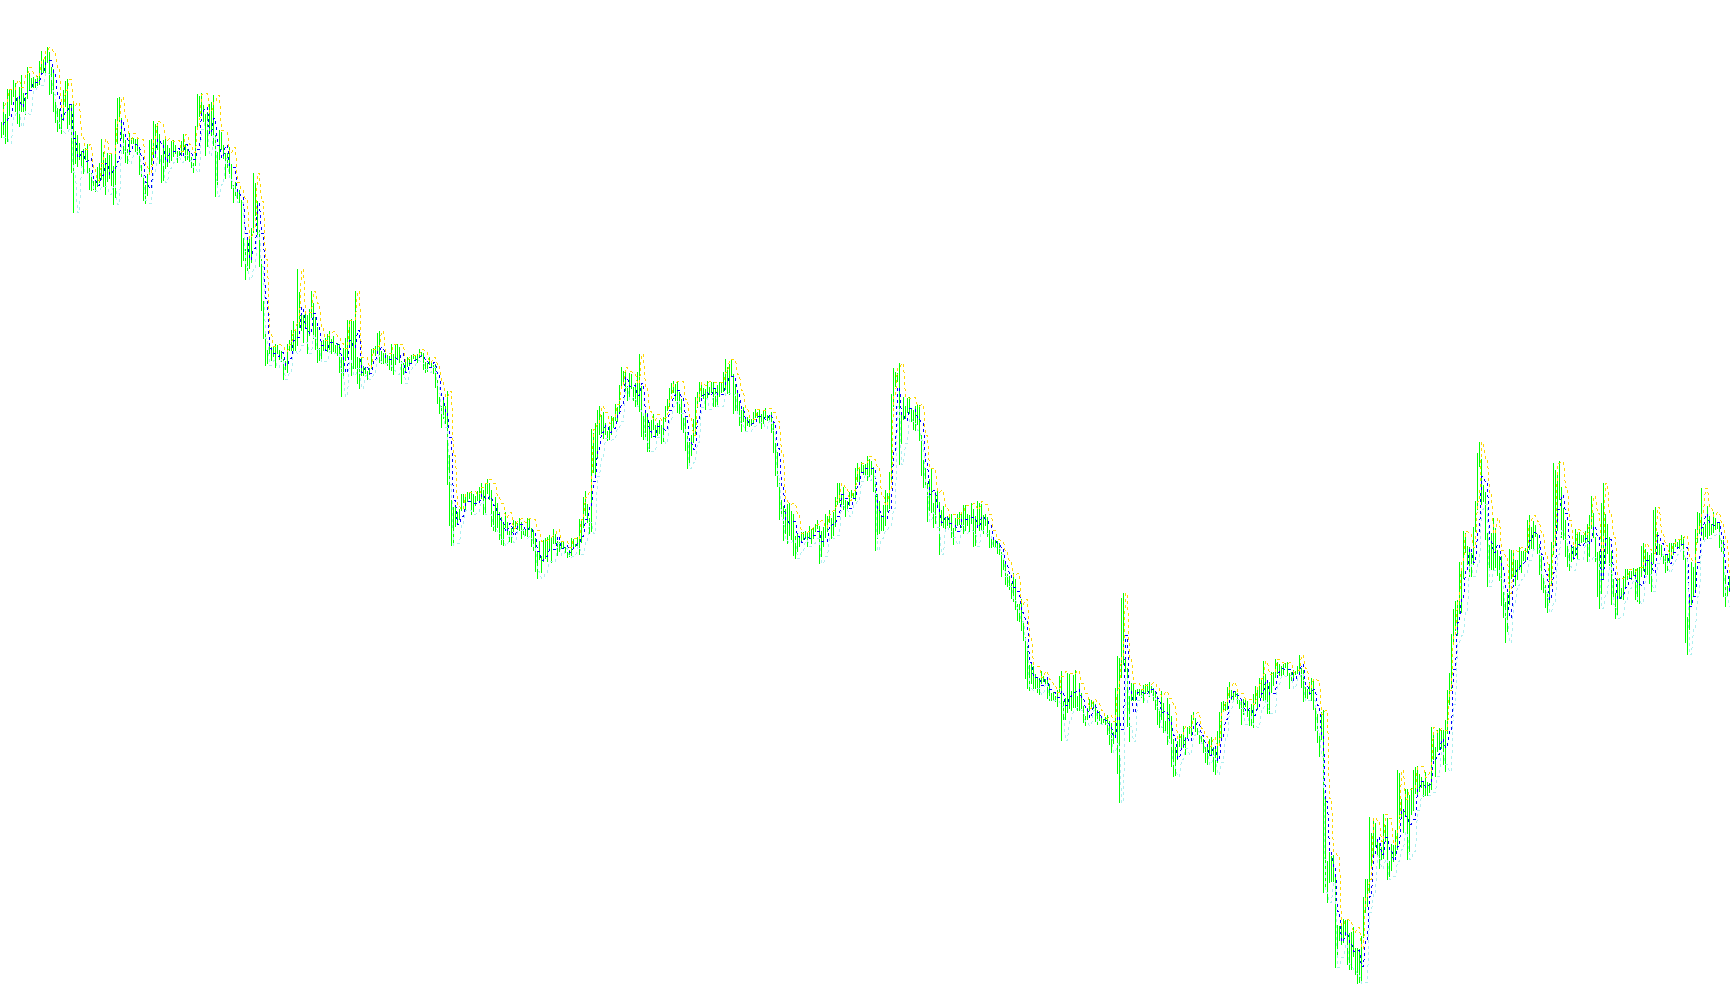
This tool is designed to help traders visualize price action by identifying key historical price levels—specifically the highest and lowest points reached over a specific timeframe. By mapping out these boundaries, it allows you to see the "trading range" of recent market activity more clearly on your chart.
How the Logic Works
The script scans your historical price data and identifies the peaks and valleys based on a time interval that you can customize (for example, looking back at the last 2 hours or a full 24-hour cycle). Here is the breakdown of its core functionality:
- Dynamic High and Low Tracking: The tool automatically finds the maximum price reached and the minimum price reached during your chosen timeframe. It then plots these as distinct lines on your chart, effectively creating a visual "box" or corridor that represents where the price has been trading.
- Median Line Calculation: In addition to showing the highs and lows, the script can calculate and display a middle line (the average of the high and low). This provides a central equilibrium point, helping you identify the midpoint of the current range.
- User-Adjustable Timeframes: You have the flexibility to define how many hours the tool should look back. This makes the script versatile for different trading styles; you can use it to monitor short-term fluctuations for scalping or broader ranges for more significant breakout strategies.
- Real-Time Data Display: While the lines appear on your chart, the script also provides a text summary in the corner of your screen. This summary gives you an immediate "snapshot" of the current data, including:
- The specific number of hours being tracked.
- The exact High and Low prices.
- The total size of the range expressed in pips.
Summary for Traders
Essentially, this script simplifies market analysis by highlighting the boundaries of recent price movement. Instead of manually searching through past candles to find where the price peaked or bottomed out, the tool draws these levels automatically. It is particularly useful for "breakout trading," where you are looking for the price to move beyond a settled range into new territory.
//+------------------------------------------------------------------------+
//| This indicator was originaly called the HiLoH4.mq4 created by Rob Judd
//| to show the last four hours' Hi and Lo on the chart. THANK YOU ROB !!
//|
//| Accrete hacked the code to ad the Median line and also the ability
//| to change the look back time to include a user variable in the pop up
//| dialog box for breakout trading on 1 hour or more boxes.
//| File can be found at Accrete.com in indicator section with kudos
//| mentioned to Rob for original code. Renamed : ATM_HiLoXTF.mq4 by Accrete
//+------------------------------------------------------------------------+


#property indicator_chart_window
#property indicator_buffers 3
#property indicator_color1 Blue
#property indicator_color2 Purple
#property indicator_color3 Red


//---- input parameters
extern int HL_Hours = 2; //24 = 24 hours and 1 would = 1 hour
extern bool show_comment=true;
extern bool show_average=true;

//---- indicator buffers
double ExtMapBuffer1[];
double ExtMapBuffer2[];
double ExtMapBuffer3[];

int init()
{
   SetIndexBuffer(0, ExtMapBuffer1);
      SetIndexStyle(0,DRAW_LINE, 2,0);
   SetIndexBuffer(1, ExtMapBuffer2);
   SetIndexStyle(1, DRAW_LINE, 2,0);
   SetIndexBuffer(2, ExtMapBuffer3);
   SetIndexStyle(2, DRAW_LINE, 2,0);
   return(0);
}

int deinit()
{
   return(0);
}

int start()
{
   int count, cur_hour, prev_hour = 0;
   double hour_high, hour_low, H, L, A = 0;

   if (Period() >= PERIOD_D1)
      return(0);

   for (count=Bars;count>=0;count--) {

      cur_hour = TimeHour(Time[count]);

      if (prev_hour != cur_hour) {

         prev_hour = cur_hour;


if (!MathMod(cur_hour,HL_Hours)) {

            H = hour_high;
            A = (hour_high+hour_low)*0.5;
            L = hour_low;


            hour_high = High[count];
            hour_low = Low[count];
         }
      }

      hour_high = MathMax(hour_high, High[count]);
      hour_low = MathMin(hour_low, Low[count]);

      ExtMapBuffer1[count] = H;
      if (show_average)
         ExtMapBuffer2[count] = A;
      ExtMapBuffer3[count] = L;
   }

   if (show_comment)
            Comment("",HL_Hours, " Hour Hi=", H, ", Lo=", L, ", Range=", (H-L)/Point, " pips" );


   return(0);
}
Comments