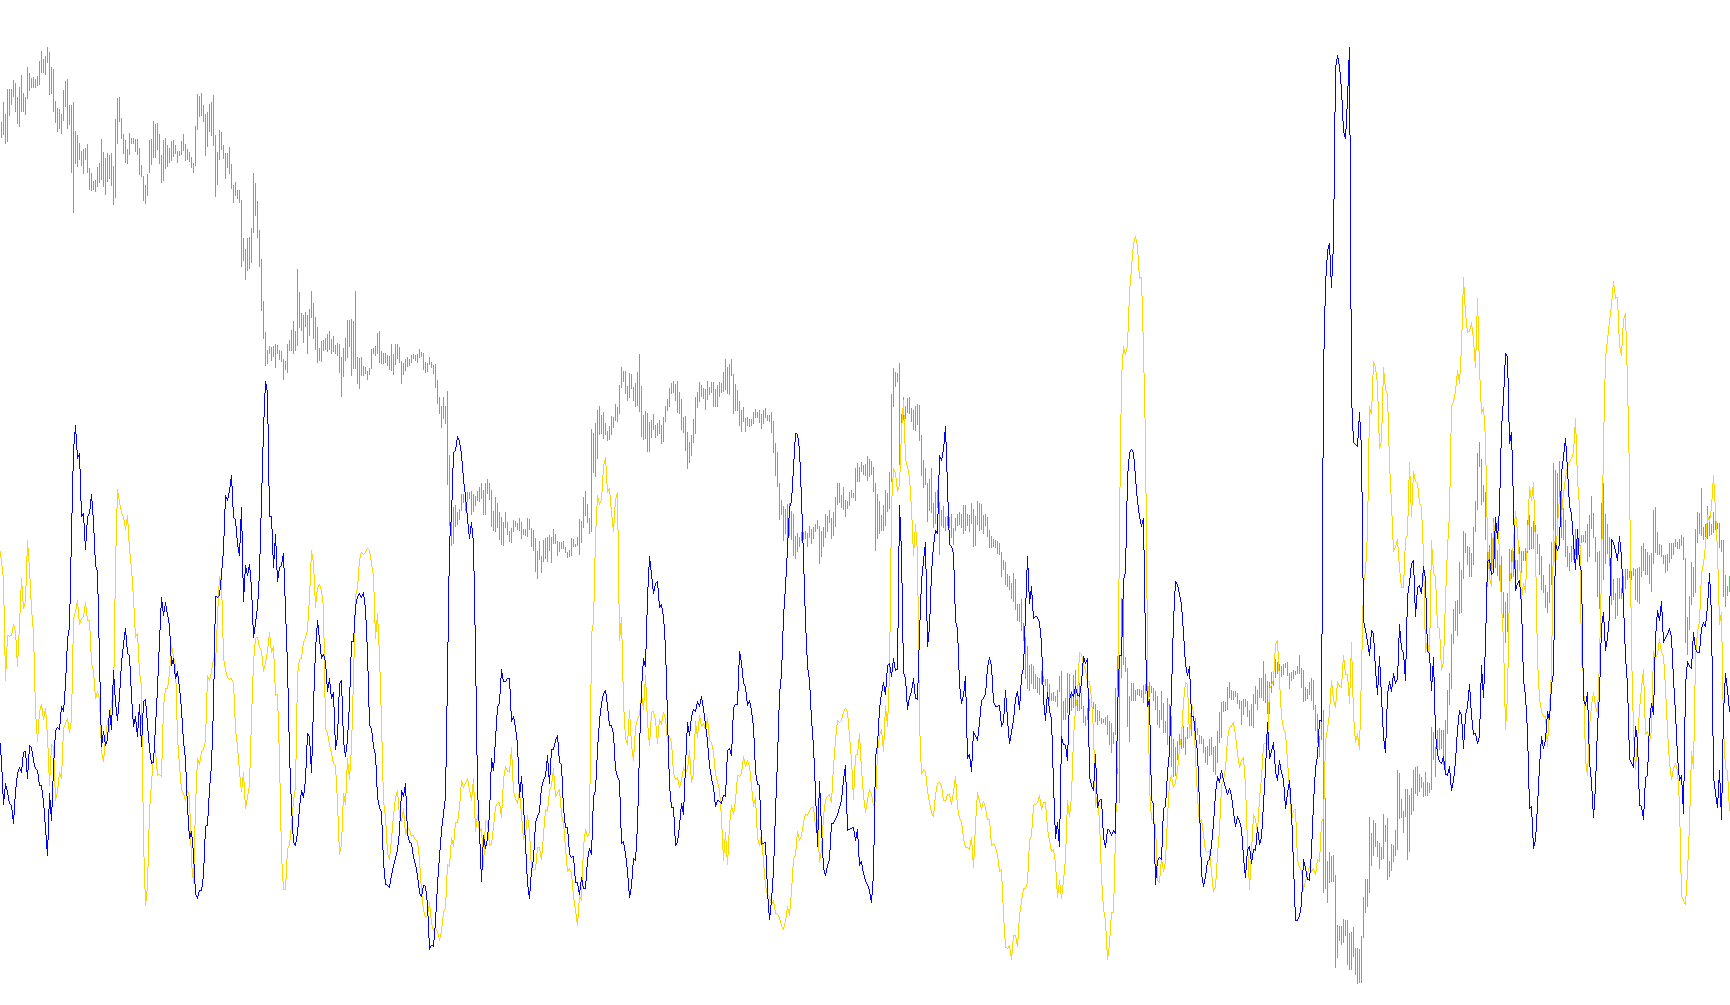
This script is a technical analysis tool designed to help traders visualize price volatility and momentum by calculating two distinct types of movement trends on a trading chart. Rather than looking at the general "up and down" movement of a price, this tool breaks down the price action into specific bullish (buying pressure) and bearish (selling pressure) components.
How the Logic Works
1. Capturing Price Movement The script looks at every candle on the chart and calculates how much "distance" was covered by the price during that specific timeframe. It does this by comparing where the price opened, where it closed, and how high or low it traveled in between.
Specifically, it separates these movements into two categories:
- Bullish Movement: It measures the upward reach of the price relative to the opening price and the previous closing price. This helps identify how much "ground" was gained by buyers.
- Bearish Movement: It measures the downward reach of the price relative to the opening price and the previous closing price, highlighting how much ground was lost or covered by sellers.
2. Smoothing the Data Because raw price movements can be very jagged and noisy—jumping wildly from one minute to the next—the script applies a smoothing process. It takes the individual measurements of bullish and bearish movements over a set number of previous candles (the period defined in the settings).
By calculating a simple moving average of these movements, the tool filters out the "noise" and produces two smooth lines on your chart.
3. Visual Representation The final output provides you with two distinct visual lines:
- The Bullish Line: Represents the averaged strength of upward price action.
- The Bearish Line: Represents the averaged strength of downward price action.
Summary for the User
Instead of just telling you if the price is going up or down, this tool helps you see the intensity of that movement. By observing these two lines, you can better understand which side of the market (buyers or sellers) is currently exhibiting more sustained momentum and volatility. The user can also choose to toggle the visibility of either the bullish or bearish line to suit their specific trading strategy.
//+------------------------------------------------------------------+
//|                                                       ATR-BB.mq4 |
//|                                    Copyright © 2007, MQL Service |
//|                                       http://www.mqlservice.com/ |
//+------------------------------------------------------------------+
//| $Id: //mqlservice/mt4files/experts/indicators/ATR-MQLS.mq4#1 $
//+------------------------------------------------------------------+
#property copyright "Copyright © 2007, MQL Service"
#property link      "http://www.metaquotes.net/"

#property indicator_separate_window
#property indicator_buffers 2
#property indicator_color1 DodgerBlue
#property indicator_color2 Red
//---- input parameters
extern int AtrPeriod=14;
extern bool ShowBull = true;
extern bool ShowBear = true;
//---- buffers
double AtrBullBuffer[];
double AtrBearBuffer[];
double TempBufferBull[];
double TempBufferBear[];
//+------------------------------------------------------------------+
//| Custom indicator initialization function                         |
//+------------------------------------------------------------------+
int init()
  {
   string short_name;
//---- 1 additional buffer used for counting.
   IndicatorBuffers(4);
//---- indicator line
   if(ShowBull)
     SetIndexStyle(0,DRAW_LINE);
   else
     SetIndexStyle(0,DRAW_NONE);
   if(ShowBear)
     SetIndexStyle(1,DRAW_LINE);
   else
     SetIndexStyle(1,DRAW_NONE);
   SetIndexBuffer(0,AtrBullBuffer);
   SetIndexBuffer(1,AtrBearBuffer);
   SetIndexBuffer(2,TempBufferBull);
   SetIndexBuffer(3,TempBufferBear);
//---- name for DataWindow and indicator subwindow label
   short_name=WindowExpertName()+"("+AtrPeriod+","+ShowBear+","+ShowBull+")";
   IndicatorShortName(short_name);
   SetIndexLabel(0,short_name+" Bull");
   SetIndexLabel(1,short_name+" Bear");
//----
   SetIndexDrawBegin(0,AtrPeriod);
//----
   return(0);
  }
//+------------------------------------------------------------------+
//| Average True Range                                               |
//+------------------------------------------------------------------+
int start()
  {
   int i,counted_bars=IndicatorCounted();
//----
   if(Bars<=AtrPeriod) return(0);
//---- initial zero
   if(counted_bars<1)
   {
      for(i=1;i<=AtrPeriod;i++) AtrBullBuffer[Bars-i]=0.0;
      for(i=1;i<=AtrPeriod;i++) AtrBearBuffer[Bars-i]=0.0;
   }
//----
   i=Bars-counted_bars-1;
   while(i>=0)
     {
      double high=High[i];
      double low =Low[i];
      double open=Open[i];
      if(i==Bars-1)
      {
        TempBufferBull[i]=high-open;
        TempBufferBear[i]=open-low;
      }
      else
        {
         double prevclose=Close[i+1];
         TempBufferBull[i]=MathMax(high,prevclose)-MathMin(open,prevclose);
         TempBufferBear[i]=MathMax(open,prevclose)-MathMin(low,prevclose);
        }
      i--;
     }
//----
   if(counted_bars>0) counted_bars--;
   int limit=Bars-counted_bars;
   for(i=0; i<limit; i++)
   {
      AtrBullBuffer[i]=iMAOnArray(TempBufferBull,Bars,AtrPeriod,0,MODE_SMA,i);
      AtrBearBuffer[i]=iMAOnArray(TempBufferBear,Bars,AtrPeriod,0,MODE_SMA,i);
   }
//----
   return(0);
  }
//+--------- Coded by Michal Rutka @ MQL Service.com ----------------+
Comments