ATR Channels_v1
Download script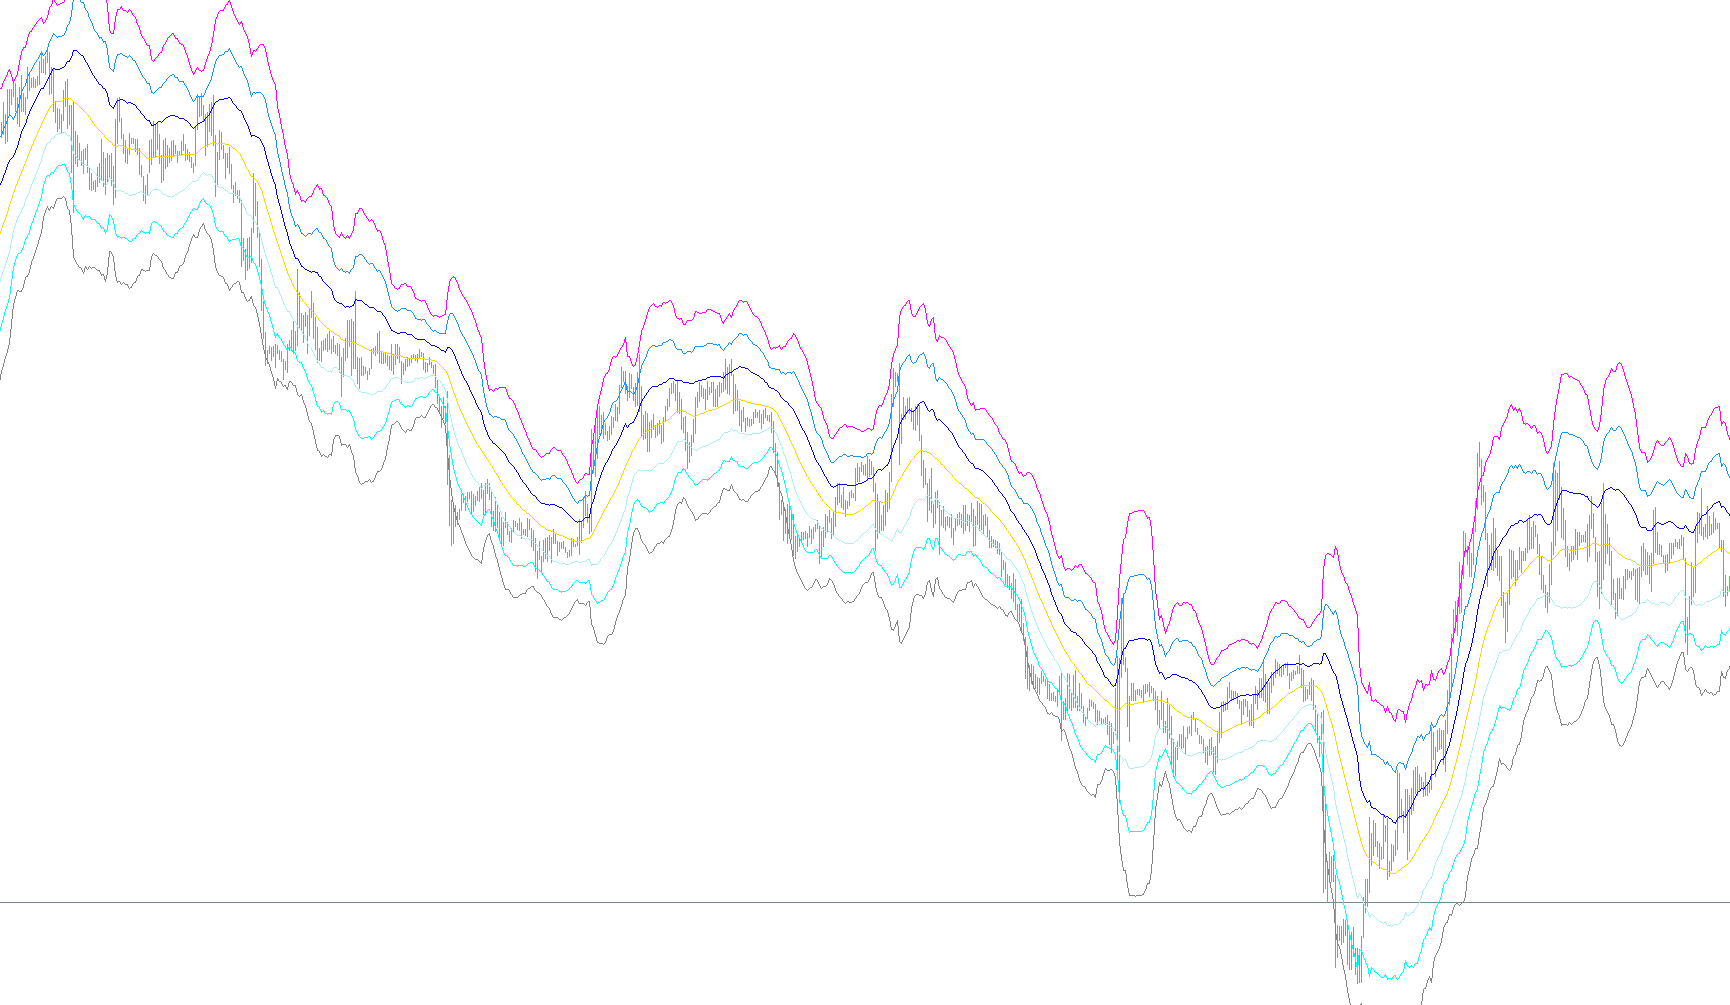
This script is designed as a visual trading tool that helps market participants understand price volatility and identify potential trend boundaries. By combining two distinct types of technical analysis—Moving Averages and Average True Range (ATR)—it creates a dynamic "channel" system on the price chart.
Core Components of the Logic
The tool functions by calculating three primary layers of information simultaneously:
1. The Central Trend Line (Moving Average) At the heart of the indicator is a Moving Average. This acts as the "baseline" for the price. It smooths out the minor fluctuations of the market to reveal the underlying direction. By using a specific weighted calculation, it provides a steady reference point to see whether the current trend is moving upward, downward, or remaining sideways.
2. The Volatility Measurement (ATR) To understand how much the price is "swinging" at any given moment, the script utilizes the Average True Range (ATR). Unlike the Moving Average, which tracks direction, the ATR measures the intensity of price movements over a specific period.
3. The Dynamic Channels The true power of this script lies in how it combines the two elements above. It takes the central trend line and projects three different "envelopes" or channels around it. These channels are created by adding and subtracting the volatility (ATR) from the center line, multiplied by three different intensity factors:
- Inner Channel: A tight boundary that represents standard market behavior.
- Middle Channel: A wider boundary that captures moderate price fluctuations.
- Outer Channel: The widest boundary, designed to identify extreme price movements or "overextended" markets.
How it Benefits the User
Instead of looking at a single static line, this tool provides a visual map of market "room."
- Volatility Awareness: When the channels expand, it signals that the market is becoming more volatile; when they contract, it shows the market is stabilizing.
- Boundary Identification: Traders can use these three levels to see how far the price has stretched away from its average. If the price touches or breaks through the outer channels, it may indicate that the move is becoming overstretched, potentially signaling a cooling-off period or a trend reversal.
- Trend Context: By keeping the Moving Average visible in the center, the user can always stay oriented to the primary direction of the market while using the surrounding colors to judge the intensity of the current price action.
//+------------------------------------------------------------------+
//|                                                 ATR Channels.mq4 |
//|                         Copyright © 2005, Luis Guilherme Damiani |
//|                                      http://www.damianifx.com.br |
//+------------------------------------------------------------------+

#property copyright "Copyright © 2005, Luis Guilherme Damiani"
#property link      "http://www.damianifx.com.br"
#property indicator_chart_window
#property  indicator_buffers 7
#property  indicator_color1  Aqua //Moving Average
#property  indicator_color2  DeepSkyBlue // Lower band 1
#property  indicator_color3  DeepSkyBlue // Upper band 1
#property  indicator_color4  RoyalBlue // Lower band 2
#property  indicator_color5  RoyalBlue // Upper band 2
#property  indicator_color6  BlueViolet // Lower band 3
#property  indicator_color7  BlueViolet // Upper band 3
//---- indicator buffers
double     MA_Buffer0[];
double     Ch1up_Buffer1[];
double     Ch1dn_Buffer2[];
double     Ch2up_Buffer3[];
double     Ch2dn_Buffer4[];
double     Ch3up_Buffer5[];
double     Ch3dn_Buffer6[];

//---- input parameters
extern int       PeriodsATR=18;
extern int       MA_Periods=49;
extern int       MA_type=MODE_LWMA;
extern double       Mult_Factor1= 1.6;
extern double       Mult_Factor2= 3.2;
extern double       Mult_Factor3= 4.8;

//+------------------------------------------------------------------+
//| Custom indicator initialization function                         |
//+------------------------------------------------------------------+
int init()
  {
  string mat;

//---7- indicators
// MA
   SetIndexStyle(0,DRAW_LINE);
   SetIndexBuffer(0,MA_Buffer0);
   SetIndexDrawBegin(0,0);
   /*if (MA_type==MODE_LWMA)SetIndexLabel(0,"WMA"+MA_Periods) else
   {
      if (MA_type==MODE_SMA) SetIndexLabel(0,"SMA"+MA_Periods) else
      {
         if (MA_type==MODE_EMA) SetIndexLabel(0,"EMA"+MA_Periods) else
         SetIndexLabel(0,"SMMA"+MA_Periods);
      };
   };*/
  // ATR 1 up
   SetIndexStyle(1,DRAW_LINE);
   SetIndexBuffer(1,Ch1up_Buffer1);
   SetIndexDrawBegin(1,0);
   SetIndexLabel(1,"ATRu "+PeriodsATR+", "+Mult_Factor1);
  // ATR 1 down
   SetIndexStyle(2,DRAW_LINE);
   SetIndexBuffer(2,Ch1dn_Buffer2);
   SetIndexDrawBegin(2,0);
   SetIndexLabel(2,"ATRd "+PeriodsATR+", "+Mult_Factor1);
// ATR 2 up
   SetIndexStyle(3,DRAW_LINE);
   SetIndexBuffer(3,Ch2up_Buffer3);
   SetIndexDrawBegin(3,0);
   SetIndexLabel(3,"ATRu "+PeriodsATR+", "+Mult_Factor2);
  // ATR 2 down
   SetIndexStyle(4,DRAW_LINE);
   SetIndexBuffer(4,Ch2dn_Buffer4);
   SetIndexDrawBegin(4,0);
   SetIndexLabel(4,"ATRd "+PeriodsATR+", "+Mult_Factor2);
   // ATR 3 up
   SetIndexStyle(5,DRAW_LINE);
   SetIndexBuffer(5,Ch3up_Buffer5);
   SetIndexDrawBegin(5,0);
   SetIndexLabel(5,"ATRu "+PeriodsATR+", "+Mult_Factor3);
  // ATR 3 down
   SetIndexStyle(6,DRAW_LINE);
   SetIndexBuffer(6,Ch3dn_Buffer6);
   SetIndexDrawBegin(6,0);
   SetIndexLabel(6,"ATRd "+PeriodsATR+", "+Mult_Factor3);
//----
   return(0);
  }
//+------------------------------------------------------------------+
//| Custor indicator deinitialization function                       |
//+------------------------------------------------------------------+
int deinit()
  {//----

//----
   return(0);
  }
//+------------------------------------------------------------------+
//| Custom indicator iteration function                              |
//+------------------------------------------------------------------+
int start()
  {
   int fixed_bars=IndicatorCounted();
   for(int i=0;i< Bars - fixed_bars;i++)
     {
         double atr=iATR(NULL,0,PeriodsATR,i);
         double ma=iMA(NULL,0,MA_Periods,0,MA_type,PRICE_TYPICAL,i);
         MA_Buffer0[i]=ma;
         Ch1up_Buffer1[i]=ma+atr*Mult_Factor1;
         Ch1dn_Buffer2[i]=ma-atr*Mult_Factor1;

         Ch2up_Buffer3[i]=ma+atr*Mult_Factor2;
         Ch2dn_Buffer4[i]=ma-atr*Mult_Factor2;

         Ch3up_Buffer5[i]=ma+atr*Mult_Factor3;
         Ch3dn_Buffer6[i]=ma-atr*Mult_Factor3;
      }

//----

//----
   return(0);
  }
Comments