ATR MA Oscillator
Download script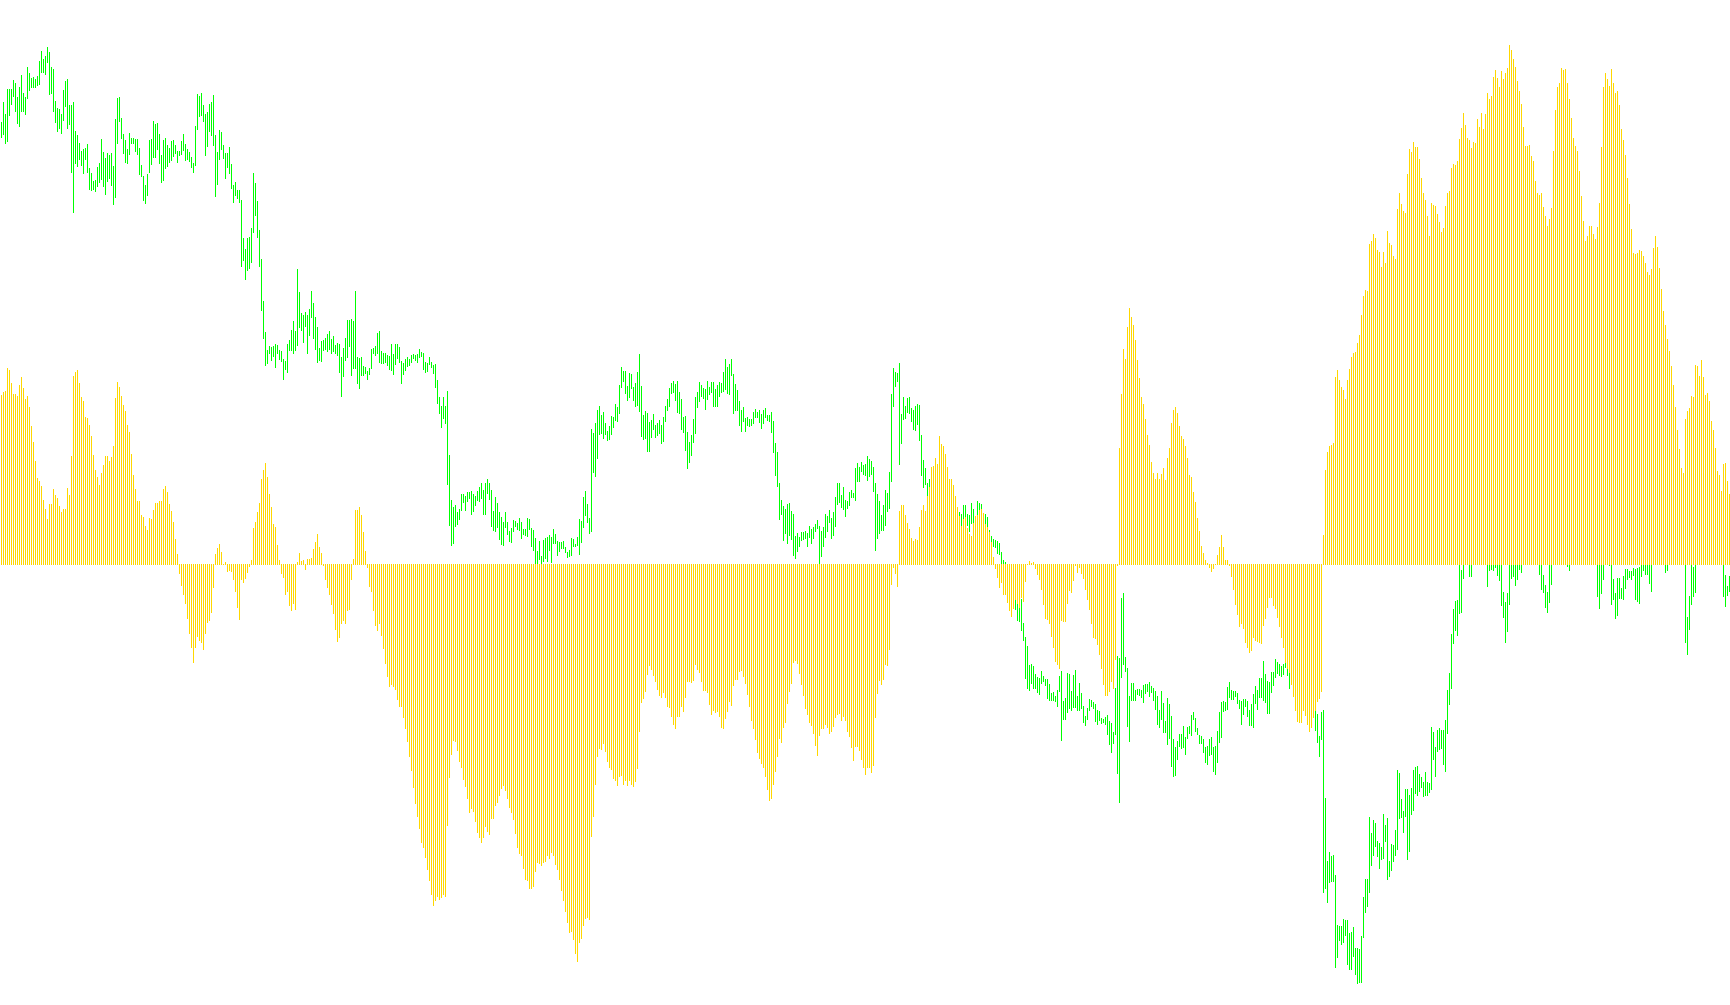
This technical indicator is designed to provide traders with a visual representation of market volatility and momentum by measuring the distance between two different types of moving averages based on price fluctuations.
Core Logic and Methodology
The tool operates by processing historical price data through three distinct stages to produce its final visual output:
1. Volatility Measurement (True Range) The script first looks at the high, low, and closing prices of every candle to determine the "True Range." Unlike a simple distance between the high and low of a single candle, this calculation also accounts for gaps between candles (for instance, if a market opens significantly higher or lower than the previous day's close). This provides a more accurate picture of how much the price is actually moving.
2. Smoothing the Data Because raw volatility data can be very "noisy" and jagged, the script applies two different types of moving averages to smooth out the information:
- The Primary Average: It takes the volatility measurements calculated in the first step and applies a moving average to them based on a user-defined period. This creates a smoothed trend of market activity.
- The Signal Average: It then takes that smoothed volatility trend and applies a second moving average to it. This acts as a "signal" line, representing the long-term momentum of the volatility.
3. The Oscillator Output The final result displayed on your chart is an Oscillator. It is calculated by subtracting the Signal Average from the Primary Average.
How to Interpret the Results
The indicator appears in a separate window below your main price chart as a histogram:
- Positive Values (Above Zero): When the primary volatility average is higher than the signal average, it indicates that current market activity is accelerating relative to its recent history.
- Negative Values (Below Zero): When the primary volatility average falls below the signal average, it suggests that market activity is cooling off or decelerating.
- Trend Strength: The height of the histogram bars shows the magnitude of this difference. Larger bars indicate a more significant divergence between current volatility and the long-term average, while bars hugging the zero line suggest a period of stability or stagnation.
By using these smoothed averages, the tool helps filter out minor price "hiccups," allowing you to focus on the broader trends of market movement and potential shifts in intensity.
#property indicator_separate_window
#property indicator_buffers 1
#property indicator_color1 DodgerBlue
#property  indicator_width1  2
//---- input parameters
extern int AtrPeriod=112;
extern int SignalSMA=109;
extern int Type_MA_ATR=2;
extern int Type_MA=2;
//---- buffers
double AtrBuffer[];
double TempBuffer[];
double OsmaBuffer[];
double SignalBuffer[];

int init()
  {
   string short_name;
//---- 4 additional buffer used for counting.
   IndicatorBuffers(4);
//---- indicator line
   SetIndexStyle(0,DRAW_HISTOGRAM);
   SetIndexDrawBegin(0,SignalSMA);
   IndicatorDigits(Digits+2);

   SetIndexBuffer(0,OsmaBuffer);
   SetIndexBuffer(1,AtrBuffer);
   SetIndexBuffer(2,TempBuffer);
   SetIndexBuffer(3,SignalBuffer);

//---- name for DataWindow and indicator subwindow label
   short_name="ATR MA Oscillator ("+AtrPeriod+","+SignalSMA+",Type MA ATR="+Type_MA_ATR+",Type MA Signal="+Type_MA+")";
   IndicatorShortName(short_name);
   SetIndexLabel(0,short_name);
//----
   SetIndexDrawBegin(0,AtrPeriod);
//----
   return(0);
  }
//+------------------------------------------------------------------+
//| Average True Range                                               |
//+------------------------------------------------------------------+
int start()
  {
   int i,counted_bars=IndicatorCounted();
//----
   if(Bars<=AtrPeriod) return(0);
//---- initial zero
   if(counted_bars<1)
      for(i=1;i<=AtrPeriod;i++) AtrBuffer[Bars-i]=0.0;
   i=Bars-counted_bars-1;

   while(i>=0)
     {
      double high=High[i];
      double low =Low[i];
      if(i==Bars-1) TempBuffer[i]=high-low;
      else
        {
         double prevclose=Close[i+1];
         TempBuffer[i]=MathMax(high,prevclose)-MathMin(low,prevclose);
        }
      i--;
     }

   if(counted_bars>0) counted_bars--;
   int limit=Bars-counted_bars;
   for(i=0; i<limit; i++)

      AtrBuffer[i]=iMAOnArray(TempBuffer,Bars,AtrPeriod,0,Type_MA_ATR,i);
   for(i=0; i<limit; i++)
      SignalBuffer[i]=iMAOnArray(AtrBuffer,Bars,SignalSMA,0,Type_MA,i);
   for(i=0; i<limit; i++)
      {
      OsmaBuffer[i]=AtrBuffer[i]-SignalBuffer[i];
      }
   return(0);
  }
Comments