ClearMethodHistogram
Download script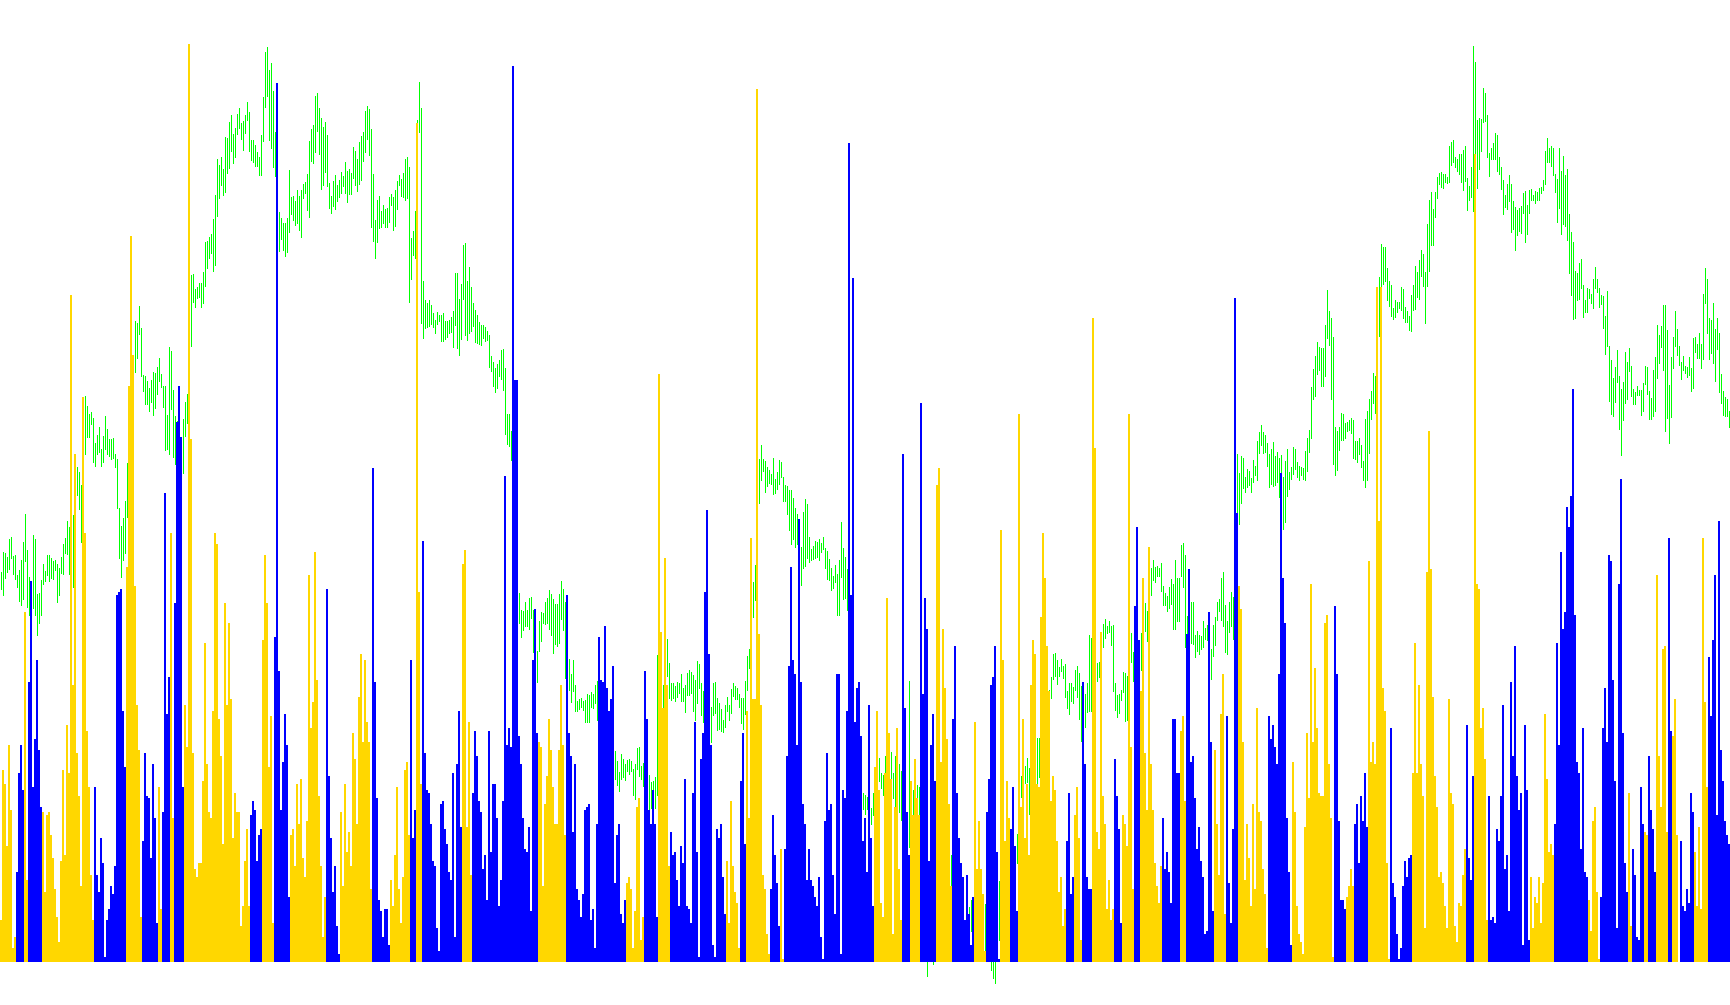
This indicator is designed to help traders visualize how far the current market price is moving relative to specific "switching thresholds." Based on the trading methodology by Ron Black, the tool aims to provide clarity during short-term market swings by identifying whether the price is trending upward or downward and measuring its distance from the trend's boundary.
How the Logic Works
The script functions by analyzing historical price data and comparing it against a secondary calculation method (provided by an external companion file). It categorizes the market into two primary states: Up Swings and Down Swings.
1. Identifying Market Direction The tool first checks the current market environment to determine the "swing" direction.
- If the market is identified as being in an Up Swing, the logic focuses on the upper boundary of that move.
- If the market is identified as being in a Down Swing, the logic shifts its focus to the lower boundary.
2. Measuring the Distance Once the direction is established, the indicator calculates a specific "distance" value:
- During an Up Swing: The tool subtracts the calculated upward threshold from the highest price reached. This shows how much "room" there is within the current move or how far the price has extended above its baseline.
- During a Down Swing: The tool subtracts the lowest price reached from the downward threshold. This helps visualize the depth of the downward move relative to its support levels.
3. Visual Representation The results are displayed in a separate window below your main chart as a histogram:
- Green Bars: These represent the distance calculated during an Up Swing.
- Red Bars: These represent the distance calculated during a Down Swing.
- The Zero Line: This acts as the equilibrium point. When the histogram is on one side of the zero line, it indicates the strength/distance of an upward move; when it is on the other, it indicates the downward move.
Summary for the Trader
In simple terms, this indicator doesn't just tell you which way the price is going—it measures the "stretch" of the current swing. By looking at the histogram, you can see at a glance whether the market is currently pushing aggressively toward a trend boundary or if it is staying close to its threshold, helping you identify more clearly where short-term swings are gaining momentum and where they might be reaching their limits.
// This indicator is based on the article: Getting Clear With Short-Term Swings by Ron Black
//
// http://www.traders.com/Documentation/FEEDbk_docs/2010/09/Black.html
// http://www.traders.com/Documentation/FEEDbk_docs/2010/09/TradersTips.html
//
// The histogram shows the distance from the actual switching threshold
// Copy the ClearMethod.mq4 file to the Indicator directory, it will be used by iCustom()

#property indicator_separate_window

#property indicator_buffers 2
#property indicator_color1 Green
#property indicator_color2 Red
#property indicator_level1 0

int maxHistoryBarsToCount = 50000;

double DistanceFromThresholdBuffer1[];
double DistanceFromThresholdBuffer2[];

int init() {
   SetIndexStyle(0, DRAW_HISTOGRAM, STYLE_SOLID, 2);
   SetIndexBuffer(0, DistanceFromThresholdBuffer1);
   SetIndexStyle(1, DRAW_HISTOGRAM, STYLE_SOLID, 2);
   SetIndexBuffer(1, DistanceFromThresholdBuffer2);
   return(0);
}

int start() {
   int countedBars = IndicatorCounted();
   int countFrom = MathMin(Bars - countedBars - 1, maxHistoryBarsToCount);

   if (countFrom >= 0 && countFrom < Bars) {
      countIndicator(countFrom);
   }
   return(0);
}

int countIndicator(int countFrom) {
   int i;
   bool isUpSwing;
   double upSwingLine;
   double downSwingLine;

   for (i = countFrom; i >= 0; i--) {
      isUpSwing = (iCustom(NULL, 0, "ClearMethod", 0, i) > 0);
      if (isUpSwing) {
         upSwingLine = iCustom(NULL, 0, "ClearMethod", 1, i);
         DistanceFromThresholdBuffer1[i] = High[i] - upSwingLine;
         DistanceFromThresholdBuffer2[i] = 0.0;
      } else {
         downSwingLine = iCustom(NULL, 0, "ClearMethod", 2, i);
         DistanceFromThresholdBuffer1[i] = 0.0;
         DistanceFromThresholdBuffer2[i] = downSwingLine - Low[i];
      }
   }
   return(0);
}
Comments