candle_time_end_and_spread
Download script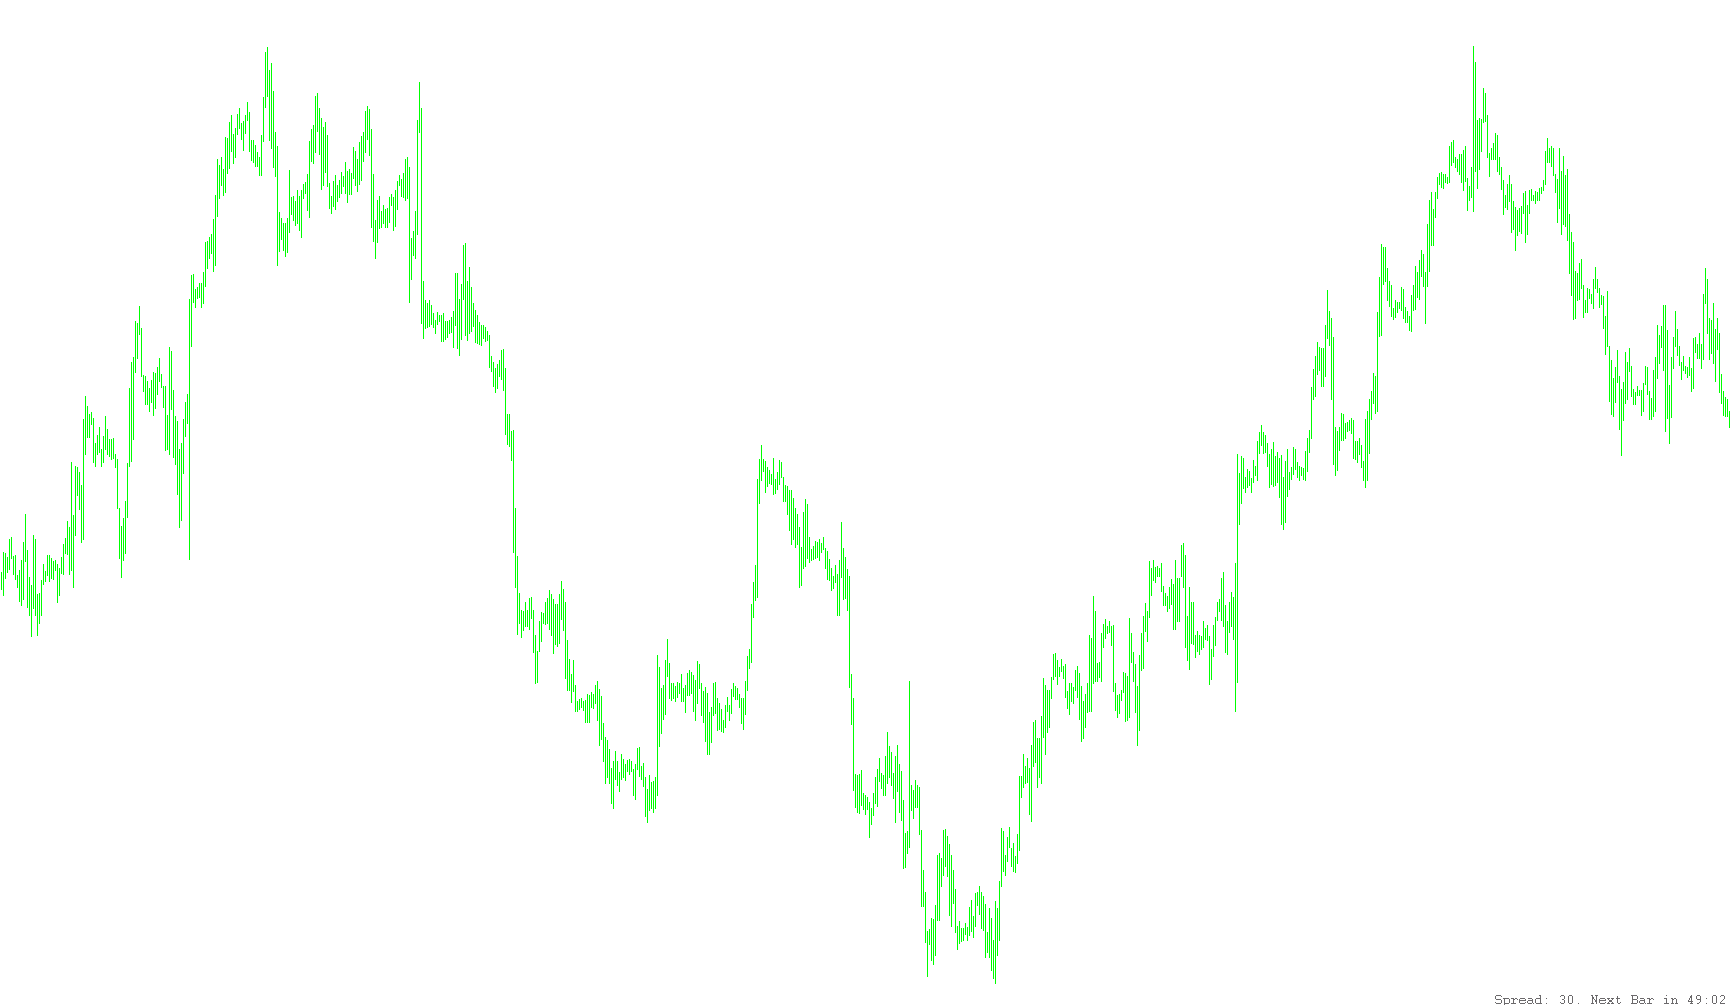
This tool is designed to provide traders with real-time, at-a-glance information regarding market conditions and timing directly on their trading chart. By transforming complex backend data into a simple visual display, it helps users monitor two critical factors simultaneously: the current cost of entering a trade (the spread) and the remaining time until the next price candle forms.
How it Works
Market Spread Monitoring The script continuously tracks the "Spread," which represents the difference between the buy and sell prices in the market. To make this data easier to read, the tool automatically adjusts its formatting based on the size of the spread:
- For very low spreads, it uses a double-dot notation.
- For moderate spreads, it uses a single-dot notation. This ensures that the information remains clean and professional regardless of the specific asset being traded.
Countdown Timer One of the primary functions of this script is to calculate exactly how much time remains before the current price candle expires and a new one begins. It performs the following logic:
- It identifies the current timeframe you are viewing.
- It calculates the remaining minutes and seconds until the next transition.
- It automatically formats these numbers (adding leading zeros where necessary) so that the timer remains consistent and easy to read (e.g., "05:09" instead of "5:9").
Visual Presentation The information is displayed as a stationary text label on your screen, rather than floating over the price bars. This allows you to keep the data in a fixed location—customizable to different corners of your chart—so it doesn't obstruct your view of the price action. The display is designed to be clear and legible, using a standard font and a customizable color to ensure it stands out against your background.
Key Benefits for the Trader
- Precision Timing: Know exactly how many seconds are left in a candle to manage entries or exits more effectively.
- Cost Awareness: Keep a constant eye on the spread to ensure you are trading during periods of favorable liquidity.
- Clean Interface: By consolidating two different data points into one organized text line, it reduces visual clutter on your trading workspace.
//+------------------------------------------------------------------+
//|                                          CandleTimeStationary.mq4|
//|                                                                  |
//|                                                                  |
//+------------------------------------------------------------------+

#property indicator_chart_window
//---- input parameters

extern color  Clock_Color = DimGray;
extern string Corner_Placement = "1 is top right 3 is bottom right";
extern int    Corner = 3;


string objname="Spread&Bar";
double s1[];

//+------------------------------------------------------------------+
//| expert initialization function                                   |
//+------------------------------------------------------------------+
int init(){

  ObjectCreate(objname, OBJ_LABEL,0, 0, 0);
  ObjectSet(objname, OBJPROP_CORNER, Corner);
  ObjectSet(objname, OBJPROP_XDISTANCE, 10);
  ObjectSet(objname, OBJPROP_YDISTANCE, 2);

   //----
   return(0);
}
//+------------------------------------------------------------------+
//| expert deinitialization function                                 |
//+------------------------------------------------------------------+
int deinit(){

  ObjectDelete(objname);

  //----
  return(0);
}


//+------------------------------------------------------------------+
//| expert start function                                            |
//+------------------------------------------------------------------+
int start()
{

   //Time to bar expiry
  int m,s;

  m=Time[0]+Period()*60-CurTime();
  s=m%60;
  m=(m-s)/60;
  int spread=MarketInfo(Symbol(), MODE_SPREAD);

  string _sp="",_m="",_s="";
  if (spread<10) _sp="..";
  else if (spread<100) _sp=".";
  if (m<10) _m="0";
  if (s<10) _s="0";

  ObjectSetText(objname,"Spread: " +DoubleToStr(spread,0)+_sp+" Next Bar in "+_m+DoubleToStr(m,0)+":"+_s+DoubleToStr(s,0), 10, "Courier", Clock_Color);
  return(0);
}
//+---------------------------------------------------------
Comments