ClearMethodCandles1
Download script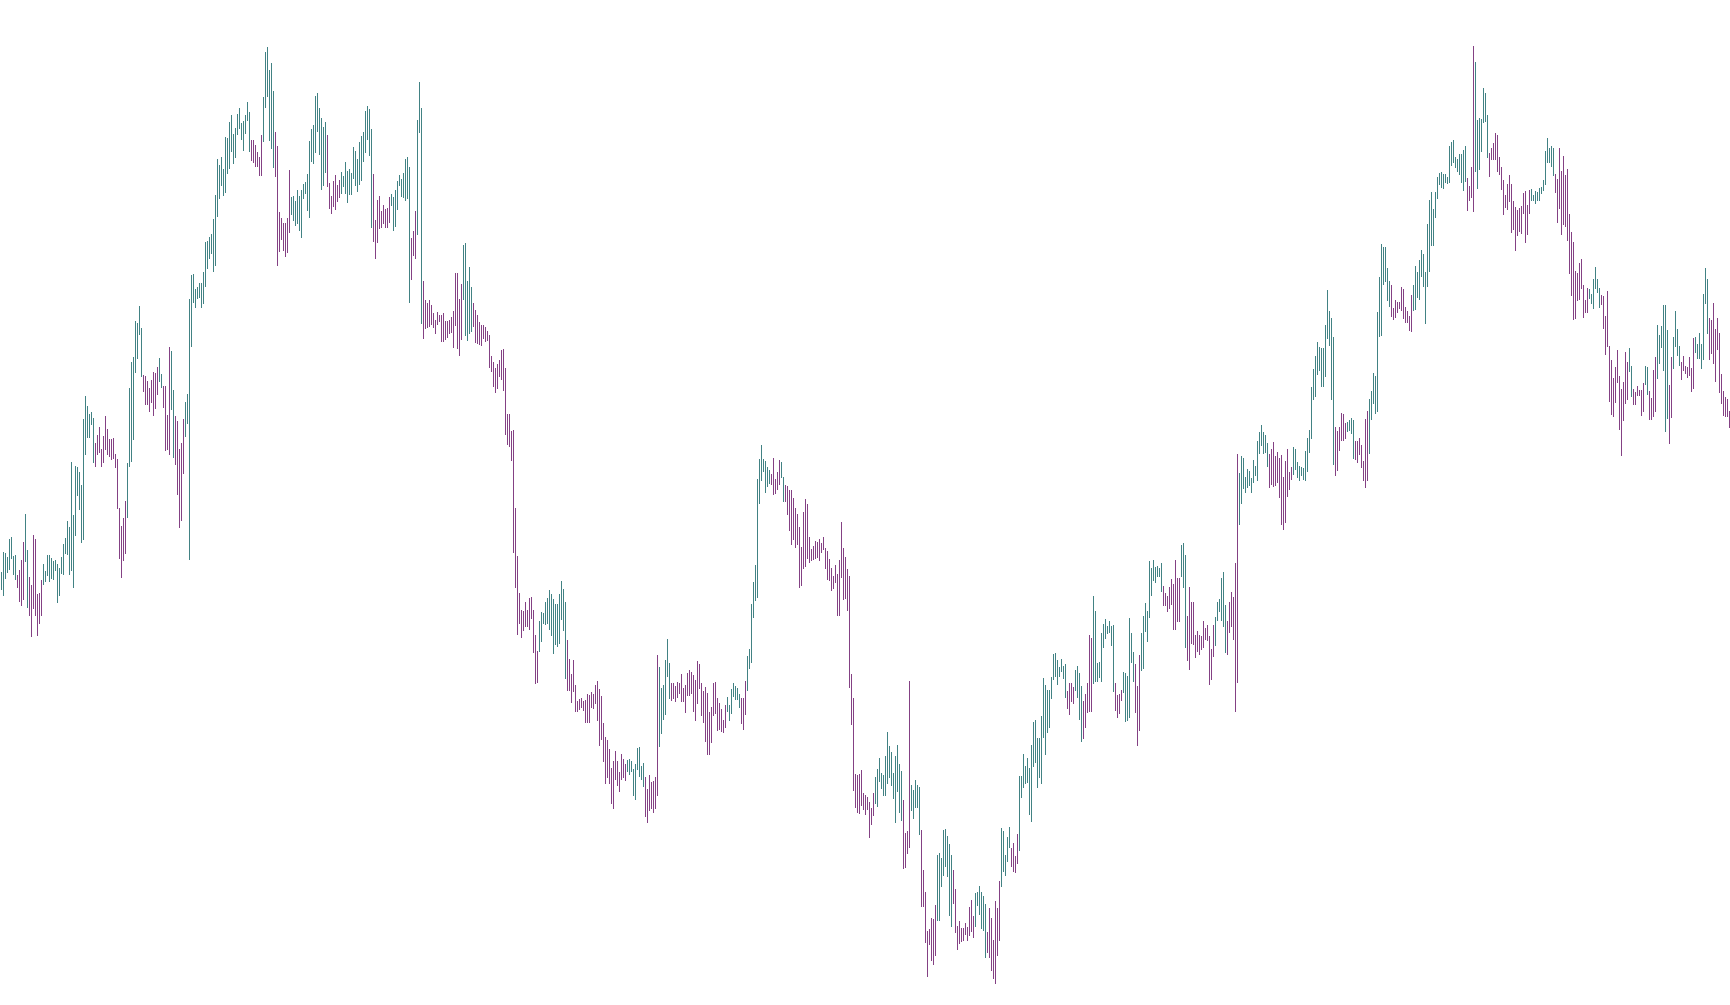
This tool is designed to enhance your visual analysis of market trends by highlighting specific price movements, specifically focusing on "Short-Term Swings" as described in the trading literature by Ron Black. Instead of traditional candles which can sometimes clutter the screen with too much detail, this script provides a cleaner way to visualize the direction and strength of the market.
How the Logic Works
The core functionality of this script relies on identifying whether the current market movement is an upward or downward swing. It achieves this by communicating with a secondary calculation method to determine the "swing" status for every bar on your chart.
1. Movement Detection The script looks back through your trading history (up to 50,000 bars) and checks each price point. It identifies whether the market is currently in an "Up Swing" or a "Down Swing" phase.
2. Visual Reconstruction Once the direction of the swing is identified, the script redraws the visual representation of the price action:
- Up Swings: When the market moves upward, the script highlights the price action using specific colors (defaulting to a teal/grey shade, or Lime/Orange if you prefer a high-contrast black background). It organizes the price data to emphasize the upward movement.
- Down Swings: Conversely, when the market is moving downward, it switches to a different color scheme and adjusts the visual boundaries to highlight the downward pressure.
3. Handling Price Nuances The logic is sophisticated enough to handle "Doji" candles (where the opening and closing prices are identical). In these instances, where there is no clear direction, the script applies a tiny mathematical offset to ensure that the visual indicator remains visible and distinct on your screen without disappearing or overlapping awkwardly.
Key Features for the User
- Visual Clarity: By using this script, you can essentially "filter" the noise of standard candles. It replaces the standard price bars with colored histograms that clearly distinguish between different market phases.
- Customizable Contrast: The tool includes a specific setting to detect if you are using a black background. If enabled, it automatically switches to brighter, high-visibility colors (Lime and Orange) so you don't miss key movements.
- Historical Analysis: It processes a large amount of historical data, allowing you to see how these swings have behaved over a long period, rather than just looking at the most recent price action.
In short, this script acts as a visual filter that categorizes every candle into an "Up" or "Down" swing, painting your chart in a way that makes it much easier to identify the immediate momentum of the market.
// This indicator is based on the article: Getting Clear With Short-Term Swings by Ron Black
//
// http://www.traders.com/Documentation/FEEDbk_docs/2010/09/Black.html
// http://www.traders.com/Documentation/FEEDbk_docs/2010/09/TradersTips.html
//
// To set up colored candle charts:
// - switch to Line Chart
// - in Chart Properties window, set Line Chart Color to None (the entire price graph will disappear)
// - copy the ClearMethod.mq4 file to the Indicator directory, it will be used by iCustom()
// - add ClearMethodCandles1 (this must be the first), then ClearMethodCandles2 to the chart
// - if you use black backgrounded chart, set IsBlackChart parameter to true for both indicator

#property indicator_chart_window

#property indicator_buffers 4
#property indicator_color1 C'64, 128, 128'
#property indicator_color2 C'128, 64, 128'
#property indicator_color3 C'64, 128, 128'
#property indicator_color4 C'128, 64, 128'

#property indicator_width1 3
#property indicator_width2 3
#property indicator_width5 1
#property indicator_width6 1

int maxHistoryBarsToCount = 50000;

extern bool IsBlackChart = false;

color UpSwingOutlineColor;
color DownSwingOutlineColor;

double CandleBuffer1[];
double CandleBuffer2[];
double ShadowBuffer1[];
double ShadowBuffer2[];

int init() {
   if (IsBlackChart) {
      UpSwingOutlineColor = Lime;
      DownSwingOutlineColor = Orange;
   } else {
      UpSwingOutlineColor = C'64, 128, 128';
      DownSwingOutlineColor = C'128, 64, 128';
   }
   SetIndexStyle(0, DRAW_HISTOGRAM, STYLE_SOLID, EMPTY, UpSwingOutlineColor);
   SetIndexBuffer(0, CandleBuffer1);
   SetIndexStyle(1, DRAW_HISTOGRAM, STYLE_SOLID, EMPTY, DownSwingOutlineColor);
   SetIndexBuffer(1, CandleBuffer2);
   SetIndexStyle(2, DRAW_HISTOGRAM, STYLE_SOLID, EMPTY, UpSwingOutlineColor);
   SetIndexBuffer(2, ShadowBuffer1);
   SetIndexStyle(3, DRAW_HISTOGRAM, STYLE_SOLID, EMPTY, DownSwingOutlineColor);
   SetIndexBuffer(3, ShadowBuffer2);

   SetIndexEmptyValue(0, 0.0);
   SetIndexEmptyValue(1, 0.0);
   SetIndexEmptyValue(4, 0.0);
   SetIndexEmptyValue(5, 0.0);

   return(0);
}

int start() {
   int countedBars = IndicatorCounted();
   int countFrom = MathMin(Bars - countedBars - 1, maxHistoryBarsToCount);

   if (countFrom >= 0 && countFrom < Bars) {
      countIndicator(countFrom);
   }
   return(0);
}

int countIndicator(int countFrom) {
   int i;
   bool isUpSwing;

   for (i = countFrom; i >= 0; i--) {
      isUpSwing = (iCustom(NULL, 0, "ClearMethod", 0, i) > 0);

      if (isUpSwing) {

         if (Open[i] == Close[i]) {
            CandleBuffer1[i] = Open[i] + Point / 10000.0;
            CandleBuffer2[i] = Close[i] - Point / 10000.0;
         } else {
            CandleBuffer1[i] = MathMax(Open[i], Close[i]);
            CandleBuffer2[i] = MathMin(Open[i], Close[i]);
         }
         ShadowBuffer1[i] = High[i];
         ShadowBuffer2[i] = Low[i];

      } else {

         if (Open[i] == Close[i]) {
            CandleBuffer1[i] = Open[i] - Point / 10000.0;
            CandleBuffer2[i] = Close[i] + Point / 10000.0;
         } else {
            CandleBuffer1[i] = MathMin(Open[i], Close[i]);
            CandleBuffer2[i] = MathMax(Open[i], Close[i]);
         }
         ShadowBuffer1[i] = Low[i];
         ShadowBuffer2[i] = High[i];

      }
   }
   return(0);
}
Comments