ChannelBalance
Download script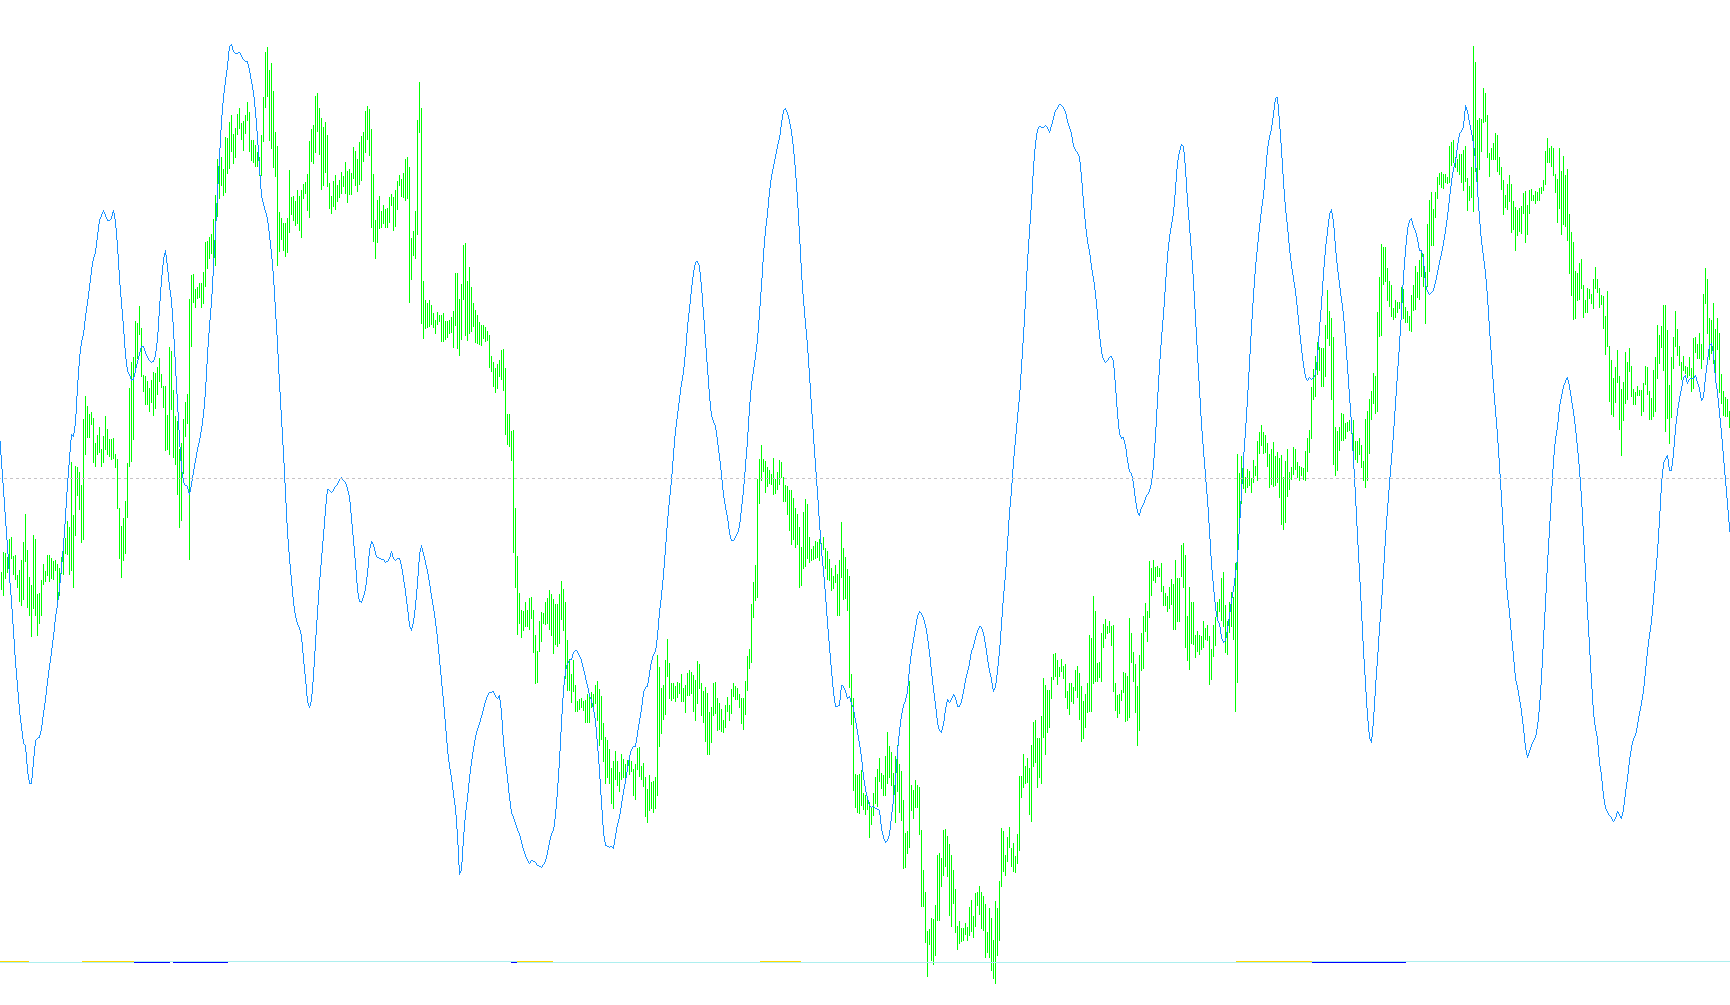
The ChannelBalance indicator is designed to provide traders with a visual representation of where the current price sits relative to its recent historical range. Rather than just looking at the raw price of an asset, this tool measures the "balance" or equilibrium within a specific look-back window of time.
How the Logic Works
The tool operates by analyzing a set number of previous price bars (which you can customize). It performs three primary actions to generate its data:
1. Defining the Boundaries First, the script identifies the highest point and the lowest point reached during your chosen timeframe. By establishing these "walls," the indicator creates a dynamic channel. The top of this channel represents the peak price, and the bottom represents the floor.
2. Calculating the Midpoint It automatically calculates the exact middle of this range (the average between the high and low). This serves as the baseline for the market's center of gravity.
3. Determining the Balance Percentage This is the core logic of the tool. For every bar in your selected period, the script calculates where the price sits within its own individual range. It essentially asks: "Is the price closer to the top, the bottom, or the middle?"
It then averages these positions over the entire period to produce a single "Balance" value. This final value is converted into a percentage (0 to 100), which is displayed in a separate window on your chart.
How to Interpret the Results
The resulting indicator provides a normalized view of market sentiment:
- High Values (Near 100): Suggest that the price has been consistently pushing toward the upper boundaries of its recent range, indicating potential overbought conditions or strong upward momentum.
- Low Values (Near 0): Suggest that the price has been gravitating toward the lower boundaries, potentially indicating oversold conditions or significant downward pressure.
- Middle Values (Near 50): Represent a state of equilibrium, where the price is oscillating around the center of its recent trading range.
By using this tool, you can quickly see if the market is leaning aggressively in one direction or if it is finding a stable balance between its highs and lows.
//+------------------------------------------------------------------+
//|                                               ChannelBalance.mq4 |
//|                                  Copyright © 2010, Shon Shampain |
//|                                       http://www.zencowsgomu.com |
//|                                                                  |
//|       Visit http://www.ZenCowsGoMu.com, an oasis of sanity       |
//|                      for currency traders.                       |
//|                                                                  |
//|       Original out-of-the-box thinking, ideas, indicators,       |
//|                    educational EAs and more.                     |
//|                                                                  |
//|         Home of the consistent T4 Forex trading signal.          |
//|            +396 pips June 2010, +1835 pips 2010 YTD              |
//|             Backtesting profitably since 1-1-2002.               |
//+------------------------------------------------------------------+

#property copyright "Shon Shampain"
#property link      "http://www.zencowsgomu.com"

#property indicator_separate_window

#property indicator_buffers 4
#property indicator_color4 Aqua

extern int max_periods = 20;
extern bool tenths = true;
int d;
double mult;
double high, low;
double upper [];
double lower [];
double middle [];
double bal [];

int init()
{
   d = Digits;
   if (tenths) d -= 1;
   mult = 1.0;
   for (int x = 0; x < d; x++)
      mult *= 10.0;

   SetIndexBuffer(0, upper);
   SetIndexBuffer(1, lower);
   SetIndexBuffer(2, middle);
   SetIndexBuffer(3, bal);

   SetLevelValue(0, 50.0);
   SetLevelStyle(STYLE_DOT, 1, Silver);

   return(0);
}

int deinit()
{
   return(0);
}

void get_high_low(int i, int max)
{
   high = 0.0;
   low = 99999.9;
   for (int j = 0; j < max; j++)
   {
      if (High[i+j] > high) high = High[i+j];
      if (Low[i+j] < low) low = Low[i+j];
   }
}

double calc_channel_balance(int i, int max)
{
   double avg_price, range, pct, total;
   double dmax = max;
   total = 0.0;
   for (int j = 0; j < max; j++)
   {
      avg_price = (High[i+j] + Low[i+j]) / 2.0;

      range = upper[i+j] - lower[i+j];

      if (range == 0.0) pct = 0.0;
      else pct = (avg_price - lower[i+j]) / range;

      total += pct;
   }
   total /= dmax;
   return(total);
}

int start()
{
   int counted_bars = IndicatorCounted();
   int i = Bars - counted_bars - 1;
   while (i >= 0)
   {
      if (i + max_periods > Bars)
      {
         upper[i] = EMPTY_VALUE;
         lower[i] = EMPTY_VALUE;
         middle[i] = EMPTY_VALUE;
         bal[i] = EMPTY_VALUE;
      }
      else
      {
         get_high_low(i, max_periods);
         upper[i] = high;
         lower[i] = low;
         middle[i] = (high + low) / 2.0;
         double val = calc_channel_balance(i, max_periods) * 100.0;
         bal[i] = val;
      }
      i--;
   }
   return(0);
}
Comments