bb_osma
Indicator

bb_osma

iMAiMAOnArrayiStdDevOnArray

This indicator synthesizes an Oscillator-based Moving Average with a dynamic volatility envelope to identify trend momentum and structural reversals.

BB_Support
Indicator

BB_Support

iBands

This indicator projects synchronized upper and lower Bollinger Band boundaries from M1, M5, H1, and D1 timeframes onto a single M1 chart to identify multi-layered volatility extremes.

BB_Support_Up
Indicator

BB_Support_Up

iBands

This indicator visualizes synchronized upper and lower Bollinger Band boundaries across three sequential higher timeframes onto the current chart to identify multi-layered support and resistance levels.

BearsBullsImpuls-2b
Indicator

BearsBullsImpuls-2b

iMA

This indicator quantifies market sentiment by measuring the aggregate deviation of high and low prices relative to a customizable moving average to determine bullish or bearish dominance.

Begashole
Indicator

Begashole

iMA

This indicator plots two distinct Exponential Moving Average lines at periods of 144 and 169 to visualize long-term trend trajectories and structural price shifts.

Bid_Line_v2
Indicator

Bid_Line_v2

This indicator renders a customizable horizontal level based on real-time price data points and overlays a dynamic countdown clock showing remaining time within the current timeframe.

Big_Times
Indicator

Big_Times

This indicator visualizes the absolute price range magnitude to identify sudden structural shifts and potential trend reversals.

BillWilliams_ATZ
Indicator

BillWilliams_ATZ

iACiAlligatoriAOiMACD
Binary_Options_Simulated_Trading
Indicator

Binary_Options_Simulated_Trading

A graphical trading interface that mimics binary options behavior by tracking simulated balances, profit margins, and time-based order expiries.

Blank
Indicator

Blank

A skeletal structural framework designed to initialize a clean workspace for custom algorithmic logic in MetaTrader 4.

blue_spread
Indicator

blue_spread

This indicator projects a real-time price corridor based on current bid-ask dynamics and scales the visual geometry according to the active chart timeframe.

BOBB_V1
Indicator

BOBB_V1

iMA

This indicator quantifies price action extremes by calculating the standard deviation of historical returns relative to a simple moving average to project upper and lower boundary offsets.

BOBB_V2
Indicator

BOBB_V2

iMA

This indicator quantifies price variance by calculating the distance from a Simple Moving Average relative to its standard deviation, smoothed through a secondary moving average overlay.

BoDi
Indicator

BoDi

iMA

This indicator calculates the standard deviation of price movements relative to a moving average to visualize dynamic volatility range and momentum shifts.

Bollinger MA Price
Indicator

Bollinger MA Price

iMA

This indicator calculates a moving average baseline and maps upper and lower boundaries based on the standard deviation of price variance from a user-selectable price point.

bouncestrengthindicator
Indicator

bouncestrengthindicator

This indicator calculates a weighted momentum index by normalizing price action against historical high-low range spreads and optional tick volume density.

bouncestrengthindicator_v2.0
Indicator

bouncestrengthindicator_v2.0

This indicator quantifies the velocity of price reversals by weighting the relative position of price action against a smoothed volatility-adjusted range.

BPA-D1LondonSession
Indicator

BPA-D1LondonSession

This indicator visualizes the price action of the London session by plotting specific candle bodies and shadows based on a defined time window on lower timeframe data.

breakevenmaster
Indicator

breakevenmaster

This script dynamically adjusts stop-loss levels to the entry price once a trade reaches a predefined profit threshold based on optional magic number and comment filters.

BreakOut
Indicator

BreakOut

This algorithm executes trades based on immediate price action breaches of previous candle extremes and employs automated position liquidation when opposing price levels are violated.

BreakOutRSI-1
Indicator

BreakOutRSI-1

iRSI

This indicator identifies market structural shifts by mapping price action against 16-period high/low extremes and average volatility zones while filtering for RSI momentum alignment.

BREW_MissingData_Cht
Indicator

BREW_MissingData_Cht

This indicator identifies and visualizes temporal discrepancies in historical data by detecting non-sequential time jumps between consecutive candles.

BREW_MissingData_sep
Indicator

BREW_MissingData_sep

This indicator detects chronological discontinuities in historical price data by calculating discrepancies between consecutive bar timestamps and accounting for market weekend closures.

Brooky_Fibbed_Donchian
Indicator

Brooky_Fibbed_Donchian

This indicator dynamically calculates a compressed price channel using extreme high/low lookbacks combined with internal Fibonacci retracement levels and a central mean line for volatility-adjusted trend identification.

Brooky_FibIt_Extension_Script
Indicator

Brooky_FibIt_Extension_Script

Automates the plotting of precise Fibonacci retracement levels with custom price extensions and descriptive labels based on historical high-low volatility.

Brooky_FibIt_Retracement_Script
Indicator

Brooky_FibIt_Retracement_Script

This script automatically generates a customizable Fibonacci retracement object based on specific historical price extrema to identify key supply, demand, and pivot zones.

Brooky_MACD_Ichimoku_V2
Indicator

Brooky_MACD_Ichimoku_V2

iMACD

This indicator projects the Ichimoku Kinko Hyo framework onto the MACD momentum values to identify trend strength and equilibrium zones within moving average crossovers.

Brooky_Minute_Overlay
Indicator

Brooky_Minute_Overlay

This indicator visually projects histogram bars on a separate window to demarcate specific hourly, half-hourly, and quarter-hourly temporal boundaries.

Brooky_Psar_Levels
Indicator

Brooky_Psar_Levels

iSAR

This indicator identifies structural price ceilings and floors by detecting parabolic SAR directional flips relative to the opening prices of preceding candles.

Brooky_Rsi_Ichimoku
Indicator

Brooky_Rsi_Ichimoku

iRSI

This indicator projects the traditional Ichimoku Kinko Hyo components onto Relative Strength Index (RSI) values to identify momentum-based trend reversals and equilibrium zones.

Brooky_Rsi_Ichimoku_V2
Indicator

Brooky_Rsi_Ichimoku_V2

iRSI

This indicator synthesizes Ichimoku Kinko Hyo components by calculating the Tenkan, Kijun, and Senkou Spans directly from RSI high and low data rather than standard price action.

Brooky_Strength_rev_1
Indicator

Brooky_Strength_rev_1

iMAOnArrayiMA

This indicator calculates a cumulative sentiment score by evaluating the directional momentum of multiple currency pairs against a base currency to determine relative market dominance.

Brooky_Trend_Strength
Indicator

Brooky_Trend_Strength

iATRiMAiMAOnArrayiStdDev

This indicator quantifies market trend intensity by calculating the differential between Standard Deviation and Average True Range, filtered through price action sensitivity and moving average directionality.

Brooky_USD_Strength
Indicator

Brooky_USD_Strength

iMAiMAOnArray

This indicator quantifies the relative strength of the US Dollar by aggregating weighted momentum signals from seven major and minor currency pairs using linear weighted moving average crossovers.

bsi_trend
Indicator

bsi_trend

This indicator synthesizes linear regression analysis with volume-weighted range ratios to identify structural trend shifts and pivot reversal points.

bspread_
Indicator

bspread_

This indicator dynamically extracts and displays the current market liquidity differential on the chart interface.

ButtonCloseBuySell
Indicator

ButtonCloseBuySell

This script provides interactive on-chart buttons to liquidate specific directional positions while displaying real-time aggregated profit, swap, and commission metrics.

buzzer
Indicator

buzzer

iMA

This indicator utilizes a weighted harmonic oscillation formula and standard deviation filtering to identify directional shifts in price momentum through smoothed trend buffers.

b_Kaufman_Efficiency_Ratio
Indicator

b_Kaufman_Efficiency_Ratio

This indicator quantifies market trend quality by dividing the net price displacement over a specific period by the cumulative sum of absolute price changes to identify high-momentum movements relative to noise.

b_Kaufman_Volatility
Indicator

b_Kaufman_Volatility

This indicator quantifies market turbulence by calculating the cumulative absolute price variance over a specific lookback window.

b_Regression_Analysis
Indicator

b_Regression_Analysis

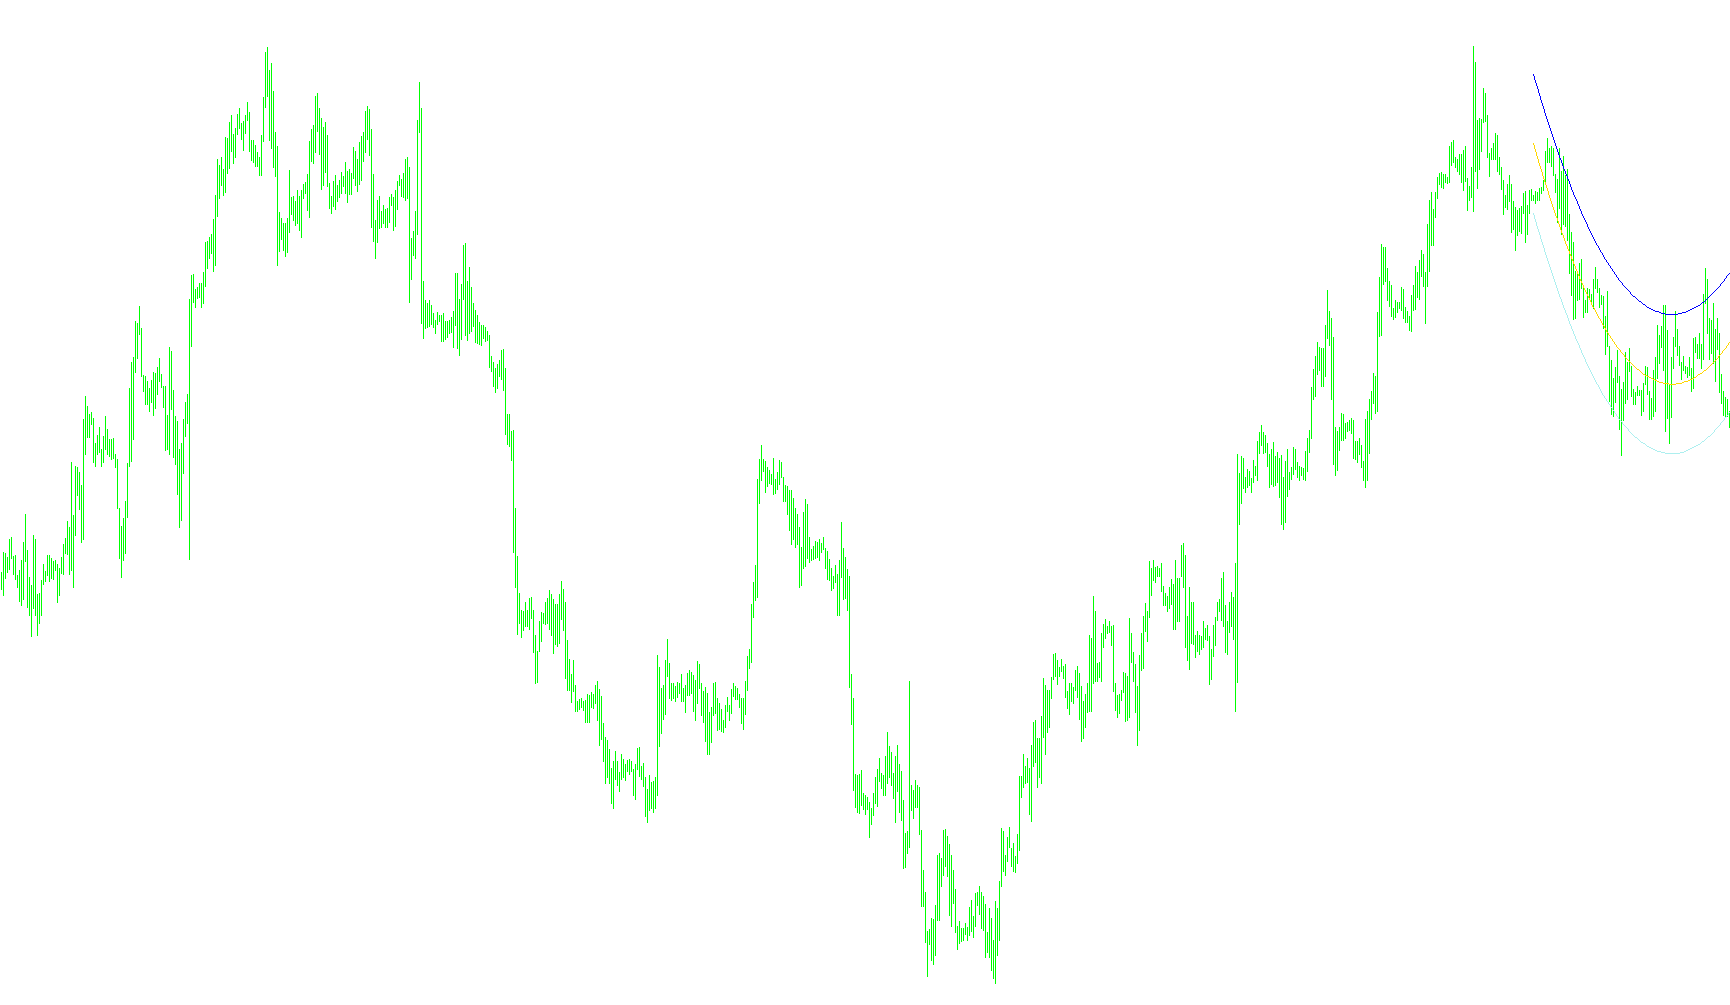
This indicator automatically evaluates linear, quadratic, logarithmic, and exponential models to project the best-fitting price curve based on the lowest standard deviation error.

b_Regression_Analysis_v2
Indicator

b_Regression_Analysis_v2

iStdDevOnArray

The script evaluates multiple mathematical models—linear, quadratic, logarithmic, and exponential—to automatically identify the curve with the lowest standard deviation and project its trend with confidence bands.

b_v2_macd_osmax
Indicator

b_v2_macd_osmax

iOsMAiMAiMAOnArray
Camarilla Pivot ALL bars
Indicator

Camarilla Pivot ALL bars

The algorithm calculates four distinct price equilibrium points based on a scaled percentage of the daily high-low range relative to the closing price.

CamarillaOnly
Indicator

CamarillaOnly

This indicator projects high-density Camarilla levels based on previous day's range, utilizing a customized midpoint calculation to synchronize the central pivot with its nearest support and resistance boundaries.

Candle-Closing-Time-Remaining-lCCTRp
Indicator

Candle-Closing-Time-Remaining-lCCTRp

Dynamically calculates and displays the precise countdown of remaining seconds until the current candlestick expires based on the selected timeframe.

candledifference
Indicator

candledifference

This indicator calculates and displays the real-time percentage variance between current market prices and the opening values of multiple predefined currency pairs on a specific timeframe.

Candles2
Indicator

Candles2

This indicator renders synthetic candlesticks on the current chart by aggregating price action from a higher timeframe based on specific chronological boundaries.

candlestrength
Indicator

candlestrength

This indicator calculates and visualizes the absolute price displacement of each candle expressed in pips to highlight momentum shifts.

Candles_Ratio_v1
Indicator

Candles_Ratio_v1

The indicator quantifies market sentiment by calculating the mathematical ratio of cumulative bullish candle bodies against cumulative bearish candle bodies over a rolling lookback window.