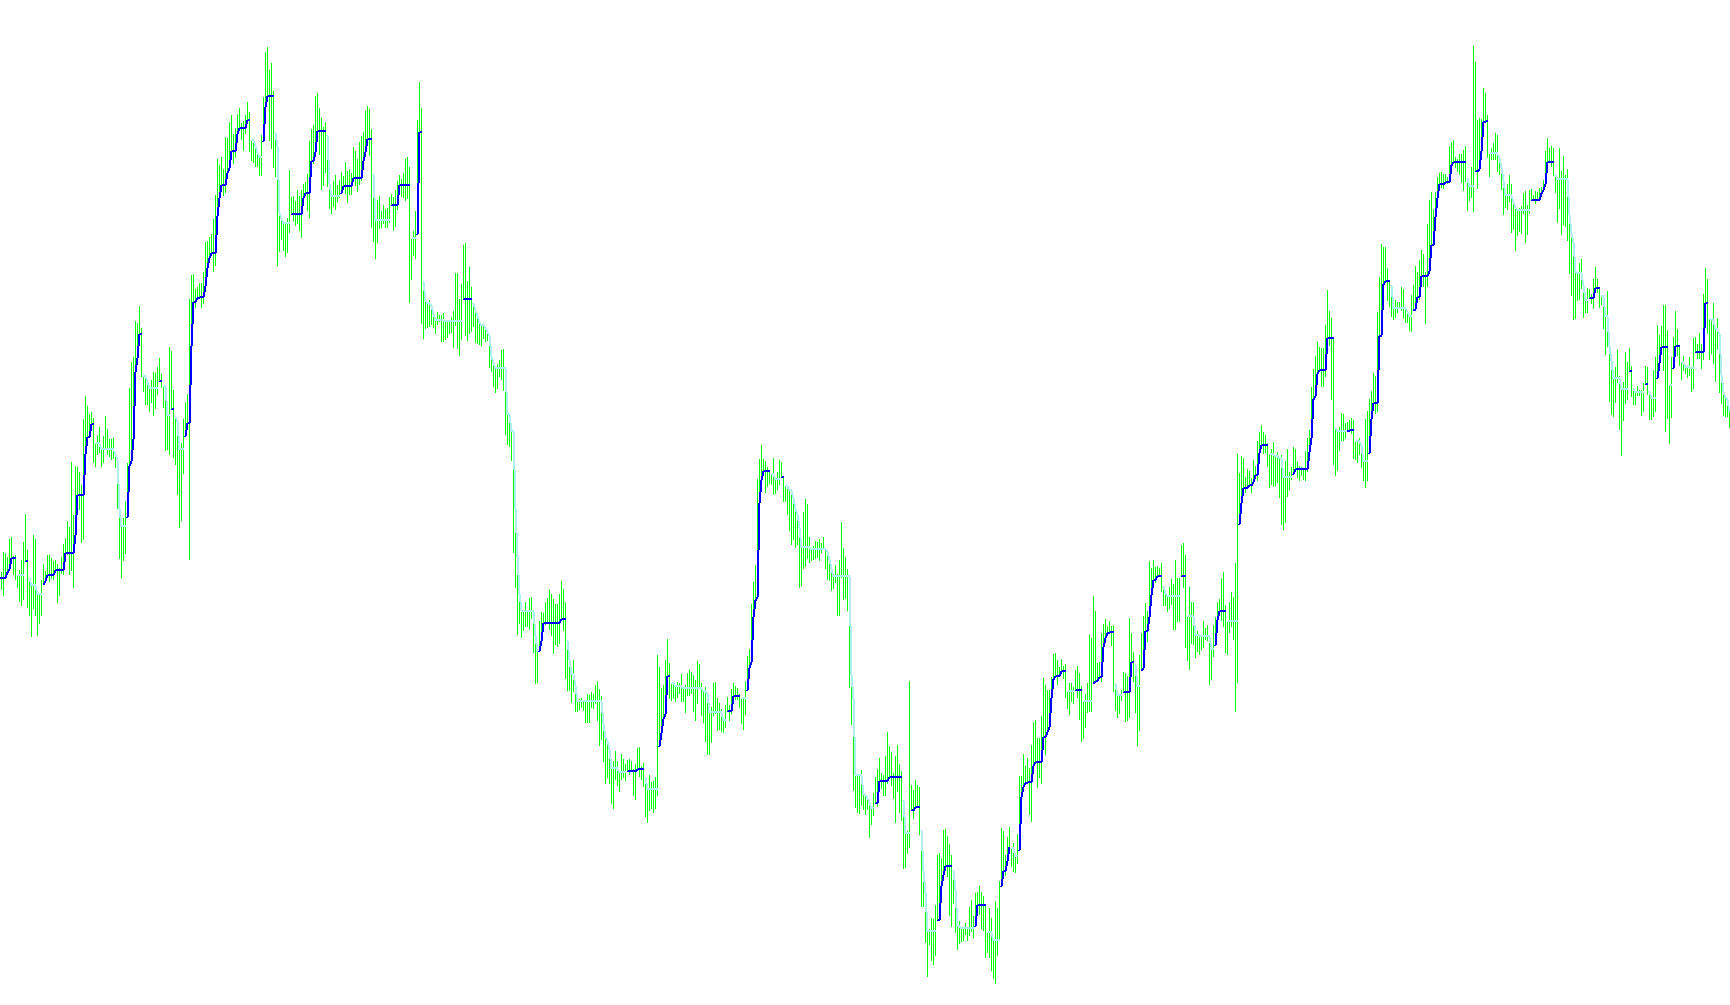
This script is a specialized visual tool designed to help traders identify and track "short-term swings" in price action. Based on the methodology by Ron Black, its primary purpose is to strip away the noise of constant market fluctuations to reveal the underlying trend—specifically by identifying when the market is moving into an "upward swing" versus a "downward swing."
How the Logic Works
The script analyzes every candle on your chart to determine the current momentum. Instead of just looking at whether a single candle closed higher or lower than the last, it tracks the "extremes" of the price movement over time.
1. Tracking Trends (Up vs. Down Swings) The core logic works by constantly updating two sets of boundaries:
- During an Up Swing: The script looks for the highest point reached. It monitors the market to see if the price remains consistently making progress. If the market begins to drop significantly—specifically, if a new candle's high is lower than the "lowest low" recorded during the current upward move—the script recognizes this as a structural shift and flips the status to a Down Swing.
- During a Down Swing: The logic reverses. It tracks the lowest points reached and monitors for a significant recovery. If the price begins to rise enough that a new candle's low is higher than the "highest high" recorded during the current downward move, it signals a shift back to an Up Swing.
2. Defining Dynamic Boundaries The indicator doesn't just tell you the direction; it identifies the specific "ceiling" or "floor" of the current swing.
- When the market is in an Up Swing, the script calculates and plots a line representing the highest level reached during that movement.
- When the market is in a Down Swing, it plots a line representing the lowest level reached.
3. Visual Representation for Traders The logic is designed to provide a "clean" view of the market. By categorizing price action into these binary states (Up Swing or Down Swing), the tool helps traders:
- Identify which direction the current momentum is flowing.
- Visualize the historical peaks and troughs of the current swing.
- Easily see when the trend has officially "flipped" based on the structural rules defined by the Black method.
In summary, this script acts as a filter that translates raw price data into a clear visual narrative of market momentum, highlighting the structural highs and lows of short-term price movements.
// This indicator is based on the article: Getting Clear With Short-Term Swings by Ron Black
//
// http://www.traders.com/Documentation/FEEDbk_docs/2010/09/Black.html
// http://www.traders.com/Documentation/FEEDbk_docs/2010/09/TradersTips.html
//
// To set up colored candle charts:
// - switch to Line Chart
// - in Chart Properties window, set Line Chart Color to None (the entire price graph will disappear)
// - copy the ClearMethod.mq4 file to the Indicator directory, it will be used by iCustom()
// - add ClearMethodCandles1 (this must be the first), then ClearMethodCandles2 to the chart
// - if you use black backgrounded chart, set IsBlackChart parameter to true for both indicator

#property indicator_chart_window

#property indicator_buffers 3
#property indicator_color1 White
#property indicator_color2 C'64, 128, 128'
#property indicator_color3 C'128, 64, 128'

int maxHistoryBarsToCount = 50000;

bool IsPrevBarUpSwing;
double PrevBarHighestHigh;
double PrevBarLowestHigh;
double PrevBarHighestLow;
double PrevBarLowestLow;

double IsUpSwingBuffer[];
double UpSwingLineBuffer[];
double DownSwingLineBuffer[];

int init() {
   SetIndexStyle(0, DRAW_NONE);
   SetIndexBuffer(0, IsUpSwingBuffer);
   SetIndexStyle(1, DRAW_LINE, STYLE_SOLID, 2);
   SetIndexBuffer(1, UpSwingLineBuffer);
   SetIndexStyle(2, DRAW_LINE, STYLE_SOLID, 2);
   SetIndexBuffer(2, DownSwingLineBuffer);

   SetIndexEmptyValue(1, 0.0);
   SetIndexEmptyValue(2, 0.0);

   IsPrevBarUpSwing = false;
   PrevBarHighestHigh = High[Bars - 1];
   PrevBarLowestHigh = High[Bars - 1];
   PrevBarHighestLow = Low[Bars - 1];
   PrevBarLowestLow = Low[Bars - 1];

   return(0);
}

int start() {
   int countedBars = IndicatorCounted();
   int countFrom = MathMin(Bars - countedBars - 1, maxHistoryBarsToCount);

   if (countFrom >= 0 && countFrom < Bars) {
      countIndicator(countFrom);
   }
   return(0);
}

int countIndicator(int countFrom) {
   int i;
   bool isUpSwing = IsPrevBarUpSwing;
   double highestHigh = PrevBarHighestHigh;
   double lowestHigh = PrevBarLowestHigh;
   double highestLow = PrevBarHighestLow;
   double lowestLow = PrevBarLowestLow;

   for (i = countFrom; i >= 0; i--) {
      if (isUpSwing) {

         highestHigh = MathMax(High[i], highestHigh);
         highestLow = MathMax(Low[i], highestLow);

         if (High[i] < highestLow) {
            isUpSwing = false;
            lowestLow = Low[i];
            lowestHigh = High[i];
         }
      }

      if (!isUpSwing) {

         lowestLow = MathMin(Low[i], lowestLow);
         lowestHigh = MathMin(High[i], lowestHigh);

         if (Low[i] > lowestHigh) {
            isUpSwing = true;
            highestHigh = High[i];
            highestLow = Low[i];
         }
      }

      if (isUpSwing) {
         IsUpSwingBuffer[i] = 1.0;
         UpSwingLineBuffer[i] = highestLow;
         DownSwingLineBuffer[i] = 0.0;
      } else {
         IsUpSwingBuffer[i] = 0.0;
         UpSwingLineBuffer[i] = 0.0;
         DownSwingLineBuffer[i] = lowestHigh;
      }

      if (i == 1) {
         IsPrevBarUpSwing = isUpSwing;
         PrevBarHighestHigh = highestHigh;
         PrevBarLowestHigh = lowestHigh;
         PrevBarHighestLow = highestLow;
         PrevBarLowestLow = lowestLow;
      }
   }
   return(0);
}
Comments