candle_snr
Download script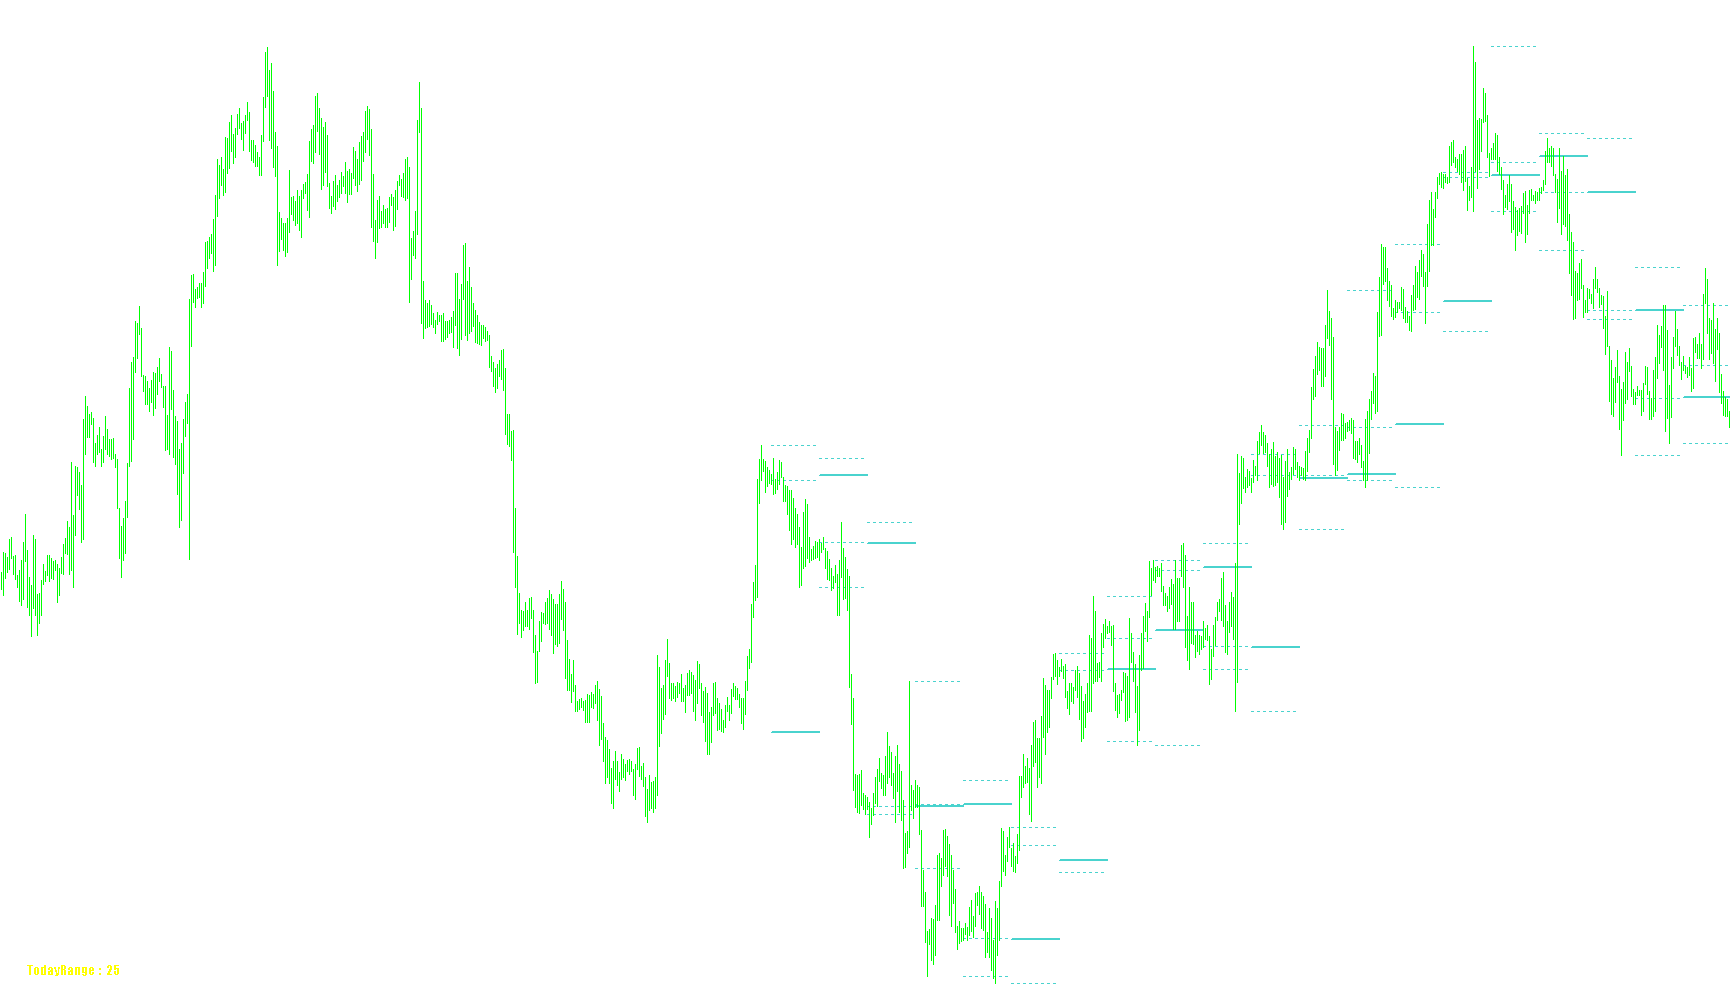
This script is designed to provide traders with a visual historical overview of key price levels by automatically plotting significant "Support and Resistance" (SnR) data directly onto the trading chart. Instead of requiring you to manually identify where the market has bounced or stalled in the past, the tool automates the identification of these critical price points based on previous candle behavior.
Core Functionality
The script scans a specific number of days—customizable by the user—to identify the essential boundaries of price action. It specifically tracks four major metrics for each period:
- Open Prices: Where the price began.
- Highs: The peak reached during that timeframe.
- Lows: The lowest point reached during that timeframe.
- Closing Prices: Where the price eventually settled.
How it Works for the User
- Dynamic Timeframe Adjustment: The tool is intelligent enough to adapt to different viewing scales. Depending on whether you are looking at a minute-by-minute chart or a daily chart, the script automatically shifts its calculation depth to ensure the data remains relevant and clear.
- Visual Mapping: It draws horizontal lines (represented as dotted trendlines) across the chart. These lines act as visual "markers" that highlight where the price moved in previous sessions. By seeing these levels, traders can better anticipate where future price action might face resistance (pushing the price down) or find support (propping the price up).
- Smart Display: To keep the chart clean, the script manages its own "workspace." It knows exactly which lines it has created and can remove them automatically to refresh the view, ensuring that your screen remains uncluttered by outdated data.
- On-Screen Analytics: In addition to the visual lines, the script provides a small information dashboard on the chart. This includes a calculation of the current "Day Range," which tells you at a glance how much price volatility has occurred during the current trading day.
Summary for Trading
Essentially, this tool acts as a historical map. It looks back over your chosen timeframe and "leaves a trail" of where the market has been. For a trader, this means being able to quickly identify historical "zones of interest," helping to inform decisions on where to place buy or sell orders based on previous market behavior.
//+------------------------------------------------------------------+
//|                                                   Candle SnR.mq4 |
//|                   Copyright 2005-2014, MetaQuotes Software Corp. |
//|                                              http://www.mql4.com |
//+------------------------------------------------------------------+
#property copyright   "2005-2014, MetaQuotes Software Corp."
#property link "http://free-bonus-deposit.blogspot.com"
#property description "Candle SnR"
#property indicator_chart_window

extern color   MainColor=MediumTurquoise;
extern int Days=20;

int BarShift=1;
double ratio;
int TimeFrame;

string Name;
color iLcolor;
//+------------------------------------------------------------------+
//|                                                                  |
//+------------------------------------------------------------------+
int init()
  {
   return(0);
  }
//+------------------------------------------------------------------+
//|                                                                  |
//+------------------------------------------------------------------+
int deinit()
  {
   DelLine();
   return(0);
  }
//+------------------------------------------------------------------+
//|                                                                  |
//+------------------------------------------------------------------+
int start()
  {
//double Range=HighPrice - LowPrice;
   datetime TimeStart;
   datetime TimeEnd;
   double DayOpen;

   if(Volume[0]<3) DelLine();

   if(Period()>=1440) TimeFrame=43200;
   if(Period()==240) TimeFrame=10080;
   if(Period()<=60) TimeFrame=1440;

   for(int x=1; x<Days+1; x++)
     {
      TimeStart=iTime(Symbol(),TimeFrame,x-1);
      TimeEnd=iTime(Symbol(),TimeFrame,x-2);

      double Hi=iHigh(Symbol(),TimeFrame,x);
      double Lo=iLow(Symbol(),TimeFrame,x);
      double Cl=iClose(Symbol(),TimeFrame,x);
      double Op=iOpen(Symbol(),TimeFrame,x);

      if(x==1) TimeEnd=TimeStart+60*100*60;

      DayOpen=iOpen(Symbol(),TimeFrame,x-1);

      if(x==1) int ray=1; else ray=0;

      iLcolor=MainColor;

      draw(" Open "+x,TimeStart,Op,TimeEnd,iLcolor,2,ray);
      draw(" Low "+x,TimeStart,Lo,TimeEnd,iLcolor,1,ray);
      draw(" High "+x,TimeStart,Hi,TimeEnd,iLcolor,1,ray);
      draw(" Close "+x,TimeStart,Cl,TimeEnd,iLcolor,1,ray);
     }
   dpkfx();
   return(0);
  }
//+------------------------------------------------------------------+
//|                                                                  |
//+------------------------------------------------------------------+
void draw(string Line,datetime TimeStart,double Price,datetime TimeEnd,color line_clr,int line_width,int ray)
  {
   ObjectCreate(Line,OBJ_TREND,0,TimeStart,Price,TimeEnd,Price);
   ObjectSet(Line,OBJPROP_COLOR,line_clr);
   ObjectSet(Line,OBJPROP_STYLE,STYLE_DOT);
   ObjectSet(Line,OBJPROP_WIDTH,line_width);
   ObjectSet(Line,OBJPROP_BACK,True);
   ObjectSet(Line,OBJPROP_RAY,ray);
  }
//+------------------------------------------------------------------+
//|                                                                  |
//+------------------------------------------------------------------+
void dpkfx()
  {
   int ipos=2;
   int xpos=30;

   double vol=(iHigh(Symbol(),1440,0)-iLow(Symbol(),1440,0))/Point;

   int st=1;
   stats("line","----------------------------",9,"Arial",White,ipos,xpos-1,42);
   stats("dpkforex","TodayRange  :  "+DoubleToStr(vol,0),10,"Impact",Yellow,ipos,xpos,30);
   stats("line2","----------------------------",9,"Arial",White,ipos,xpos-1,21);
   stats("line3","http://free-bonus-deposit.blogspot.com",9,"Arial",White,ipos,xpos-1,10);
  }
//+------------------------------------------------------------------+
//|                                                                  |
//+------------------------------------------------------------------+
void stats(string tname,string word,int fsize,string ftype,color tcolor,int posxy,int posx,int posy)
  {
   ObjectCreate(tname,OBJ_LABEL,0,0,0);
   ObjectSetText(tname,word,fsize,ftype,tcolor);
   ObjectSet(tname,OBJPROP_CORNER,posxy);
   ObjectSet(tname,OBJPROP_XDISTANCE,posx);
   ObjectSet(tname,OBJPROP_YDISTANCE,posy);
  }
//+------------------------------------------------------------------+
//|                                                                  |
//+------------------------------------------------------------------+
void DelLine()
  {
   for(int x=1; x<Days+1; x++)
     {
      ObjectDelete("OPEN"+x);

      ObjectDelete(" Open "+x);
      ObjectDelete(" Low "+x);
      ObjectDelete(" High "+x);
      ObjectDelete(" Close "+x);
     }
  }
//+------------------------------------------------------------------+
Comments