chanel_scalper
Download script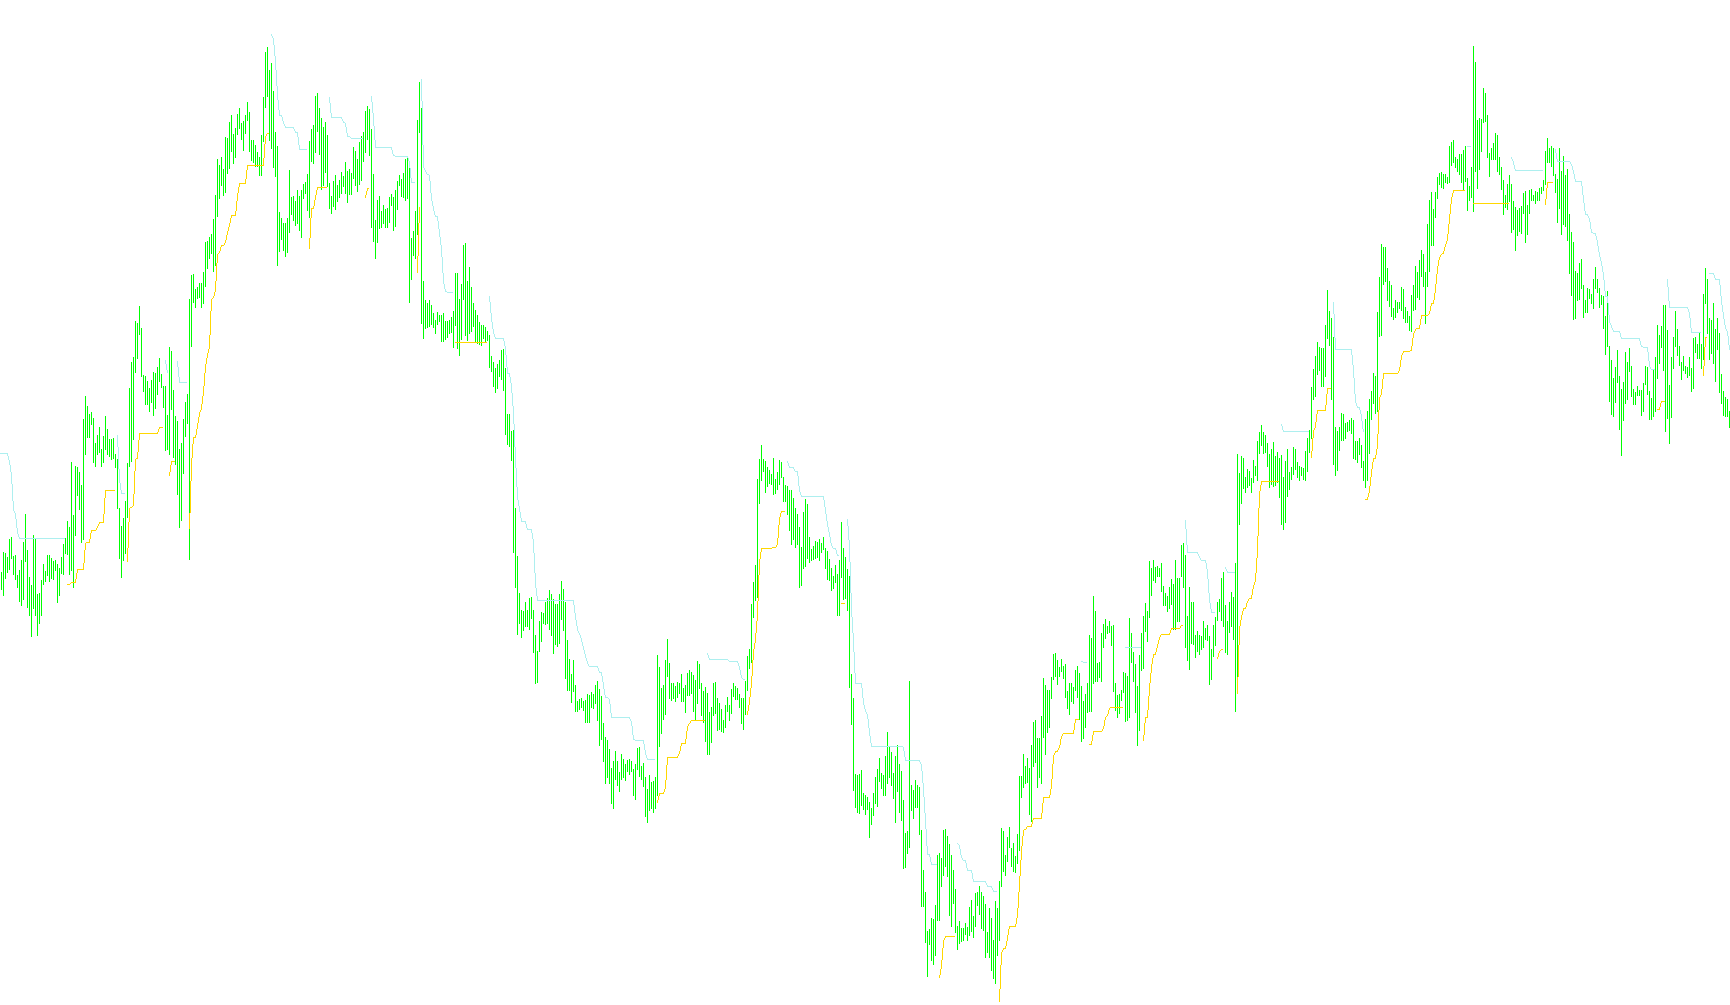
This trading tool is designed to provide a visual representation of market trends by identifying the underlying momentum and "swing" boundaries of price action. It operates by analyzing volatility and price movement relative to a specific look-back period, helping traders distinguish between active trend directions and potential reversal points.
Core Logic and Mechanism
The script functions by calculating two primary components of the market for every candle: Volatility and Price Center.
- Volatility Measurement: The tool uses a standard volatility indicator (ATR) to determine how much the price is "breathing" or swinging. By multiplying this volatility by a set factor, the script establishes a dynamic boundary around the current price.
- Dynamic Boundaries: For every price point, the script calculates an upper and lower threshold. These aren't static numbers; they expand and contract automatically based on how volatile the market is at that specific moment.
Trend Detection
The tool determines the "Direction" of the market by comparing the current closing price against the boundaries established in the previous candle.
- Bullish Sentiment: If the price closes above the upper boundary of the previous period, the system recognizes an upward trend.
- Bearish Sentiment: If the price closes below the lower boundary of the previous period, the system recognizes a downward trend.
Visual Trends and Transitions
Once a direction is established, the tool focuses on "smoothing" the trend to make it easier for the human eye to follow. Instead of showing every tiny fluctuation, it tracks the highest lows during an uptrend and the lowest highs during a downtrend.
- Trend Persistence: When the market is in an uptrend, the script monitors the progression of the lower boundaries. It essentially looks for the "floor" of the current move.
- Trend Reversals: The indicator is programmed to highlight specific moments where the trend flips. When the direction switches from upward to downward (or vice versa), the script marks these transition points, providing a clear signal that the previous price structure has broken and a new trend may be forming.
Summary for Traders
In simple terms, this tool filters out the "noise" of the market. It identifies the current path of the price by looking at how far it pushes past historical volatility boundaries. It provides a visual guide that shows you where the trend is currently heading, where the structural boundaries lie, and specifically highlights the moments when the market shifts from one direction to another.
#property indicator_chart_window
#property indicator_buffers 4
#property indicator_color1 Orange
#property indicator_color2 Orange
#property indicator_color3 Yellow
#property indicator_color4 Yellow
#property indicator_width2 1
#property indicator_width4 1
#property indicator_width1 2
#property indicator_width3 4

  int    period       = 11;
  int    appliedPrice = PRICE_CLOSE;
  double multiplier   = 2.0;

//
//
//
//
//

double TrendU[];
double TrendUA[];
double TrendD[];
double TrendDA[];
double Direction[];
double Up[];
double Dn[];

//+------------------------------------------------------------------+
//|                                                                  |
//+------------------------------------------------------------------+
//
//
//
//
//

int init()
{
   IndicatorBuffers(7);
      SetIndexBuffer(0, TrendU);
      SetIndexBuffer(1, TrendUA); SetIndexStyle(1,DRAW_NONE);
      SetIndexBuffer(2, TrendD);
      SetIndexBuffer(3, TrendDA); SetIndexStyle(3,DRAW_NONE);
      SetIndexBuffer(4, Direction);
      SetIndexBuffer(5, Up);
      SetIndexBuffer(6, Dn);

      SetIndexLabel(0,"");
      SetIndexLabel(1,"");
      SetIndexLabel(2,"");
      SetIndexLabel(3,"");
   IndicatorShortName("");
   period = MathMax(1,period);
}
int deinit()
{
   return(0);
}


//+------------------------------------------------------------------+
//|                                                                  |
//+------------------------------------------------------------------+
//
//
//
//
//

int start()
{
   int counted_bars = IndicatorCounted();
   int limit,i;

   if(counted_bars < 0) return(-1);
   if(counted_bars > 0) counted_bars--;
           limit = Bars-counted_bars;

   //
   //
   //
   //
   //

   for(i = limit; i >= 0; i--)
   {
      double atr    = iATR(NULL,0,period,i);
      double cprice = iMA(NULL,0,1,0,MODE_SMA,appliedPrice,i);
      double mprice = (High[i]+Low[i])/2;
             Up[i]  = mprice+multiplier*atr;
             Dn[i]  = mprice-multiplier*atr;

      //
      //
      //
      //
      //

      Direction[i] = Direction[i+1];
         if (cprice > Up[i+1]) Direction[i] =  1;
         if (cprice < Dn[i+1]) Direction[i] = -1;

      TrendU[i]  = EMPTY_VALUE;
      TrendUA[i] = EMPTY_VALUE;
      TrendD[i]  = EMPTY_VALUE;
      TrendDA[i] = EMPTY_VALUE;

         if (Direction[i] > 0) { Dn[i] = MathMax(Dn[i],Dn[i+1]); TrendU[i] = Dn[i]; if (Direction[i] != Direction[i+1]) TrendUA[i] = TrendU[i];}
         else                  { Up[i] = MathMin(Up[i],Up[i+1]); TrendD[i] = Up[i]; if (Direction[i] != Direction[i+1]) TrendDA[i] = TrendD[i];}
   }
   return(0);
}
Comments