cdrvolatility
Download script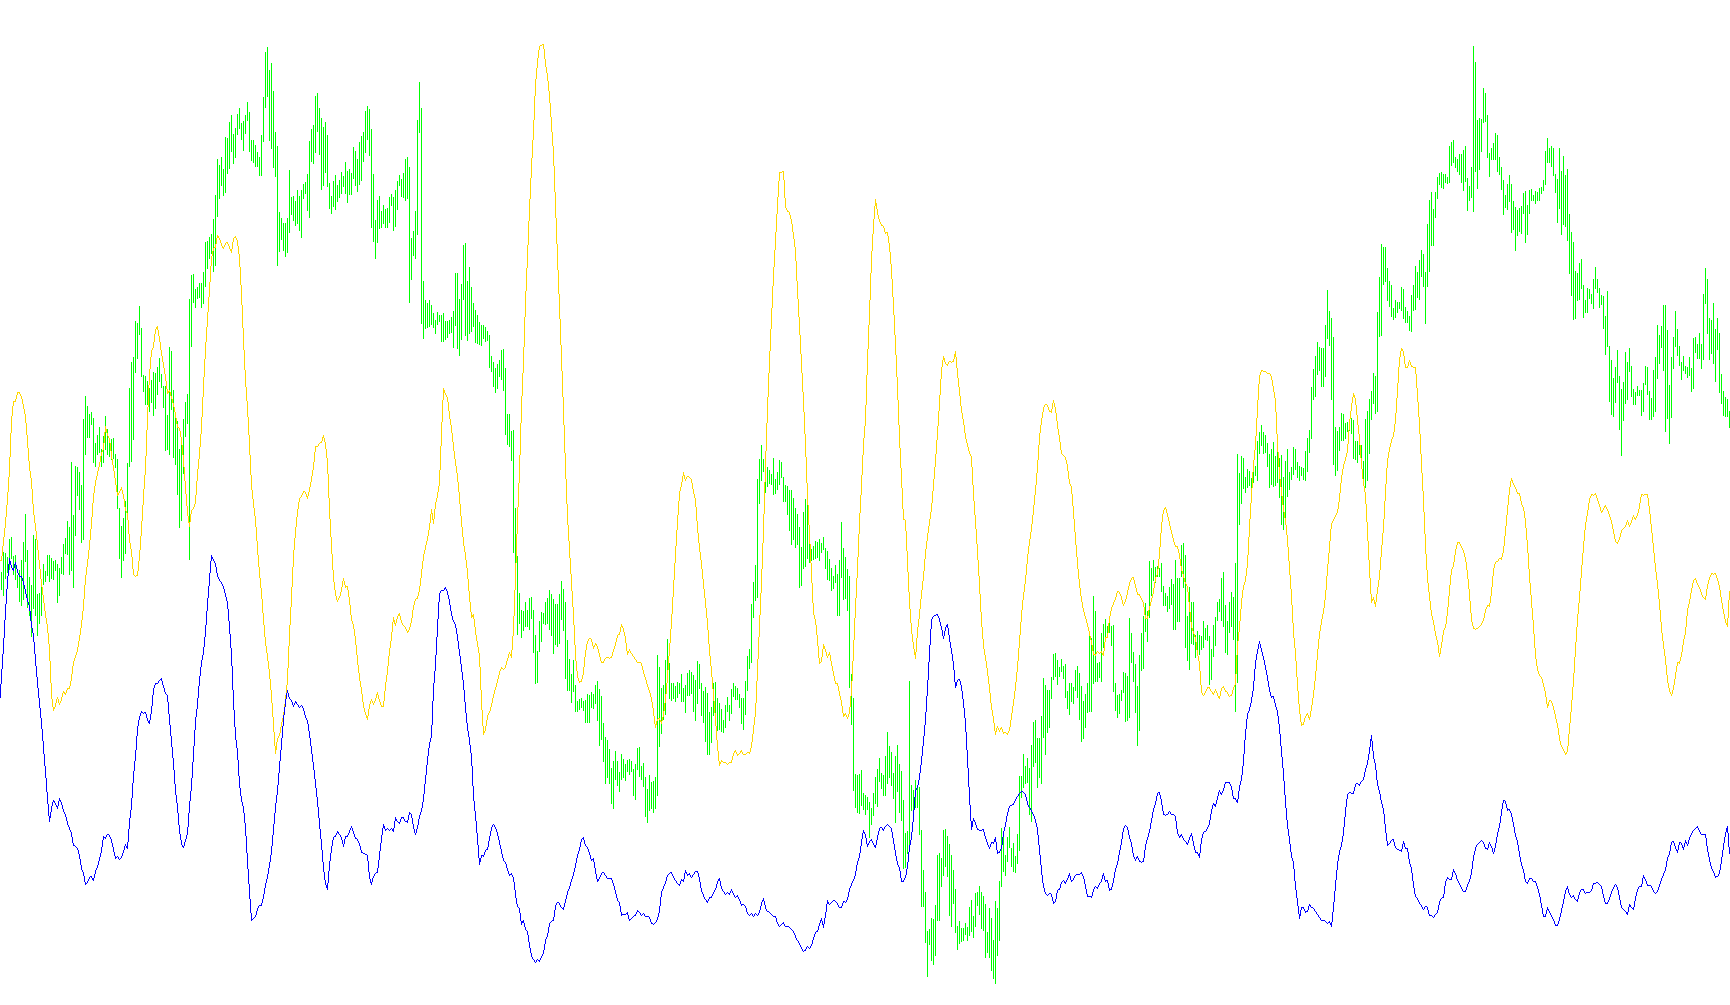
This indicator, the Convergent Divergent Range (CDR) Volatility tool, is designed to analyze market price movements by distinguishing between "convergent" and "divergent" price action over a specific period. It helps traders visualize volatility trends by filtering out minor market noise and focusing on significant price swings.
Core Logic Overview
The script works by evaluating a specific "window" of time (a set number of bars). For every candle, the tool calculates how much the price has moved relative to the starting point of that window. It specifically looks at three key data points: the opening price, the highest high, and the lowest low within that timeframe.
Key Mechanisms
1. Price Delta Filtering The indicator uses a "Threshold" system. This means it ignores small, insignificant price movements. The script calculates the total change in price from the beginning of the window to the current close. If this movement is smaller than the user-defined threshold, the tool treats the period as inactive (zero volatility). Only when a significant move occurs does the indicator begin to provide data.
2. Convergent vs. Divergent Identification When a significant price movement (meeting the threshold) is detected, the logic splits the data into two categories:
- Divergent Volatility: This represents the "outer" reach of the price movement. It tracks the extreme distance from the starting price to either the highest high or the lowest low, depending on the direction of the trend.
- Convergent Volatility: This tracks the opposite extreme of the range, providing a balanced view of how far the price has stretched in its primary path versus its secondary pull.
3. Dynamic Smoothing (SMA) To ensure the data is readable and not "choppy," the script applies a Simple Moving Average (SMA) to both the Convergent and Divergent values.
- Smart Counting: A unique feature of this logic is that it dynamically adjusts the moving average. If the price hasn't met the volatility threshold frequently, the indicator automatically reduces the average calculation to only include the "active" bars. This prevents the smoothed lines from being dragged down by periods of inactivity, keeping the visual data relevant to actual market action.
Visual Output
The script produces two distinct lines in a separate window:
- Convergent Line: Represents the smoothed trend of one side of the price range volatility.
- Divergent Line: Represents the smoothed trend of the opposing side of the price range volatility.
By observing the distance between these two lines and their overall trends, traders can gauge the intensity and expansion of market volatility over time on higher timeframes (H1, H4, and D1).
//+------------------------------------------------------------------+
//|                                                CDRVolatility.mq4 |
//|                                       Copyright © Ricahrd Poster |
//|                                                                  |
//| Convergent Divergent Range Volatility Indicator                  |
//| Guide to settng S/L, T/P and T/S                                 |
//| Best use on H1,H4 D1 charts                                      |
//| raposterbnl@gmail.com                                            |
//+------------------------------------------------------------------+
#property copyright "Richard Poster"
#property link      "http://www.metaquotes.net/"
//---
#property indicator_separate_window
#property indicator_buffers 2
#property indicator_color1  DodgerBlue
#property indicator_color2  Red
#property indicator_minimum    0
//---
#property indicator_level1     50.0
#property indicator_level2    100.0
#property indicator_level3    200.0
//---- input parameters
extern int      SMAPeriod=20;
extern string   noteCDRWindow=" # of bars in Window (open of 1st bar to close of last bar)";
extern int      CDRWindow=12;
extern string   noteDeltaThreshold=" Abs Val of Price Change from start to end of window ";
extern double   DeltaThrshld=0.;
extern int      MaxBars=10000;
//---- buffers
double  CnvBuffer[];
double  DvrBuffer[];
double _point,MULT;
int    _digits;
string _symbol;
int    BCtr,BarPrev;
double VDValAry1[],VDValAry2[],VDFnlAry1[],VDFnlAry2[];
//+------------------------------------------------------------------+
//| Custom indicator initialization function                         |
//+------------------------------------------------------------------+
int init()
  {
   string short_name,short_name1,short_name2;
//---- 1 additional buffer used for counting.
   IndicatorBuffers(2);
//---- indicator line
   SetIndexStyle(0,DRAW_LINE);
   SetIndexStyle(1,DRAW_LINE);
   SetIndexBuffer(0,CnvBuffer);
   SetIndexBuffer(1,DvrBuffer);
//---- name for DataWindow and indicator subwindow label
   short_name=" CDR SMAPer, Window, Thrshld ("+SMAPeriod+", "+CDRWindow+", "+DeltaThrshld+" )";
   short_name1="Convergent";
   short_name2="Divergent";
   IndicatorShortName(short_name);
   SetIndexLabel(0,short_name1);
   SetIndexLabel(1,short_name2);
//----
   SetIndexDrawBegin(0,SMAPeriod+CDRWindow);
   SetIndexDrawBegin(1,SMAPeriod+CDRWindow);
//----
   _symbol= Symbol();
   _point =  MarketInfo(Symbol(),MODE_POINT);
   _digits= MarketInfo(Symbol(),MODE_DIGITS);
   MULT=1.0;
   if(_digits==5 || _digits==3)
      MULT=10.0;
//---
   BCtr=0;
   BarPrev=0;
   ArrayResize(VDValAry1,SMAPeriod);
   ArrayResize(VDValAry2,SMAPeriod);
   ArrayResize(VDFnlAry1,SMAPeriod);
   ArrayResize(VDFnlAry2,SMAPeriod);
//---
   return(0);
  }
//+------------------------------------------------------------------+
//| Convergent Diverent Range                                        |
//+------------------------------------------------------------------+
int start()
  {
   double VolDvr,VolCnv,VolDvrAvg,VolCnvAvg;
   double VDeltaHi,VDeltaLo,VDeltaCl,VDVal1,VDVal2;
   int i,jj,mm,limit,NumAvg,counted_bars;
   bool NewBar;
//---
   counted_bars=IndicatorCounted();
//----
   if(Bars<=SMAPeriod+CDRWindow) return(0);
//----
   if(counted_bars<1)
     {
      for(i=1;i<=SMAPeriod;i++) CnvBuffer[Bars-i]=0.0;
      for(i=1;i<=SMAPeriod;i++) DvrBuffer[Bars-i]=0.0;
      BCtr=0;
      BarPrev=0;
     }
//----
   NewBar=false;
   if(Bars>BarPrev)
     {
      NewBar=true;
      BarPrev=Bars;
     }
   if(counted_bars>0) counted_bars--;
   limit=Bars-counted_bars;     // = 1 in steady state
   if(counted_bars==0) limit=MathMin(MaxBars,limit);   //  max bars when starting
                                                       // go forward in time to use previous values if indicator for SMA
   for(i=limit-1;i>=0;i--)
     {
      BCtr+=1;
      VolDvr = 0.;
      VolCnv = 0.;
      // compute VolDvr, VolCnv for current bar
      VDeltaCl = (Close[i] - Open[i+CDRWindow-1])/(_point*MULT);
      VDeltaHi = (High[Highest(_symbol,0,MODE_HIGH,CDRWindow,i)] -
                  Open[i+CDRWindow-1])/(_point*MULT);
      VDeltaLo=(Low[Lowest(_symbol,0,MODE_LOW,CDRWindow,i)]-
                Open[i+CDRWindow-1])/(_point*MULT);
      // do threshold test for delta price over CDRWindow bars
      if(MathAbs(VDeltaCl)>=DeltaThrshld)
        {
         VDVal1 =  MathAbs(VDeltaHi);    // divergent case  (VDeltaCl <=0)
         VDVal2 =  MathAbs(VDeltaLo);    // convergent case (VDeltaCl <=0)
         if(VDeltaCl>0.) VDVal1 = MathAbs(VDeltaLo);  // divergent
         if(VDeltaCl>0.) VDVal2 = MathAbs(VDeltaHi);  // convergent
         VolDvr = VDVal1;   // divr
         VolCnv = VDVal2;   // cnvr
        }
      //---  populate indicator arrays for computing SMA
      //---  shift each element down by one
      if(NewBar)
        {
         for(jj=SMAPeriod-1;jj>0;jj--)
           {
            VDValAry1[jj] = VDValAry1[jj-1];
            VDValAry2[jj] = VDValAry2[jj-1];
           }
        }
      //--- store/update current bar
      VDValAry1[0]=VolDvr;  // will be 0 when price delta not reach Threshold
      VDValAry2[0]= VolCnv;
      NumAvg=SMAPeriod;
      if(BCtr<SMAPeriod) NumAvg=BCtr;
      //--- handle case when threshold >0 and price change less than threshold
      mm=0;
      if(NumAvg==SMAPeriod)
        {
         for(jj=0;jj<SMAPeriod;jj++)
           {
            if(VDValAry1[jj]>0.)
              {
               VDFnlAry1[mm] = VDValAry1[jj];
               VDFnlAry2[mm] = VDValAry2[jj];
               mm+=1;
              }
           }
         NumAvg=mm;     // new sum total after removing below threshold values
        }
      //--- get SMA
      CnvBuffer[i] = 0.;
      DvrBuffer[i] = 0.;
      if(NumAvg>0)
        {
         VolDvrAvg = iMAOnArray(VDFnlAry1,NumAvg,NumAvg,0,MODE_SMA,0);
         VolCnvAvg = iMAOnArray(VDFnlAry2,NumAvg,NumAvg,0,MODE_SMA,0);
         CnvBuffer[i] = VolCnvAvg;
         DvrBuffer[i] = VolDvrAvg;
        }
     }
//----
   return(0);
  }
//+------------------------------------------------------------------+
Comments