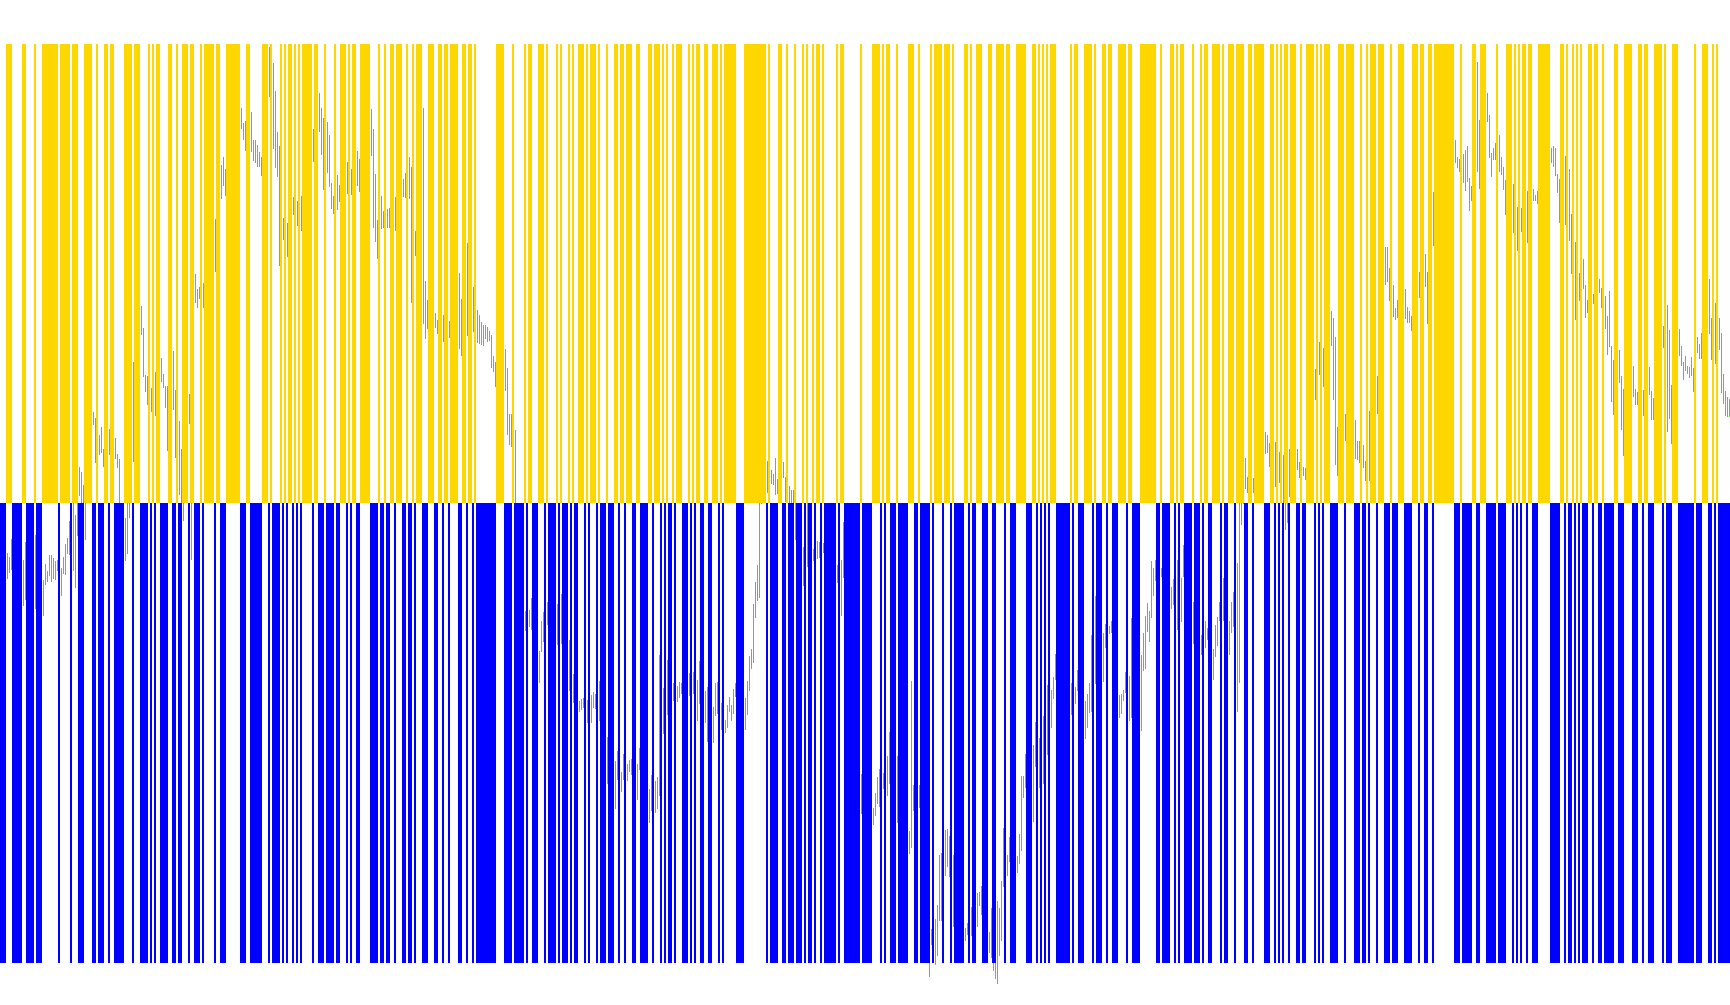
This technical indicator is designed to track and visualize significant price movements by identifying "breakout" trends in the market. Rather than simply looking at whether the price is going up or down, it monitors the intensity and continuity of price action based on a specific distance threshold.
How the Logic Works
The indicator operates by establishing a "price boundary" that moves with the market. Its primary goal is to detect when the current price pushes significantly far beyond the previous highs or lows.
1. Trend Detection (The Breakout Mechanism) The tool looks at each new price candle to see if it has moved past a specific point from the previous peak or valley.
- Upward Momentum: If the current price rises above the established high by a predefined amount, the script recognizes this as a positive movement. It then updates the "high" boundary to this new level and increments a counter.
- Downward Momentum: Conversely, if the price drops below the established low by that same distance, it recognizes a negative movement, updates the "low" boundary, and tracks that shift accordingly.
2. Measuring Strength The indicator doesn't just say "up" or "down"; it keeps track of how many consecutive breakout movements have occurred in a single direction. This allows it to distinguish between a minor fluctuation and a sustained trend of price action.
3. Visual Representation The script translates these mathematical calculations into two distinct visual signals:
- Upward Signal (XO Up): When the price consistently breaks upward through your set threshold, the indicator generates a positive value represented in green. This represents a period of sustained bullish momentum.
- Downward Signal (XO Down): When the price consistently breaks downward through the threshold, the indicator generates a negative value represented in red. This represents a period of sustained bearish momentum.
Summary for Traders
Essentially, this tool filters out "market noise." It ignores small price wiggles and only reacts when the price moves with enough strength to break past your chosen limit. By looking at the histogram, you can see where trends are gaining strength and where the market is actively moving in a specific direction with conviction.
//+------------------------------------------------------------------+
//|                                                           XO.mq4 |
//|                                   Original Author SHARIPOV AINUR |
//|               Conversion to MT4 and modification only adoleh2000 |
//+------------------------------------------------------------------+
#property copyright "Copyright © 2005, MetaQuotes Software Corp."
#property link      "http://www.metaquotes.net"

#property indicator_separate_window
#property  indicator_buffers 2
#property  indicator_color1  Lime  //XO up
#property  indicator_color2  Red  //XO down

extern double KirPER=5;//10
double cb,valuel,valueh,CurrentBar;
double Kir ,Hi, Lo, KirUp, KirDn,mode,cnt,cnt1,cur,kr,no;
double ExtMapBuffer1[]; // XO up
double ExtMapBuffer2[]; // Xo down
int loopbegin;


//+------------------------------------------------------------------+
//| Custom indicator initialization function                         |
//+------------------------------------------------------------------+
int init()
  {
     IndicatorBuffers(2);
//---- drawing settings

   SetIndexBuffer(0,ExtMapBuffer1);//bbMacd line
   SetIndexStyle(0,DRAW_HISTOGRAM,STYLE_SOLID,3);//2


   SetIndexBuffer(1,ExtMapBuffer2);//Upperband line
   SetIndexStyle(1,DRAW_HISTOGRAM,STYLE_SOLID,3);//2

  IndicatorShortName("XO ("+KirPER+"), "+valueh+","+valuel);
  SetIndexLabel(0,"XO Up");
  SetIndexLabel(1,"XO Down");


//---- indicators
//----
   return(0);
  }
//+------------------------------------------------------------------+
//| Custom indicator iteration function                              |
//+------------------------------------------------------------------+
int start()
  {
      int limit;
   int counted_bars=IndicatorCounted();
//---- check for possible errors
   if(counted_bars<0) return(-1);
//---- last counted bar will be recounted
   if(counted_bars>0) counted_bars--;

      loopbegin = Bars-1;
      for(int i = loopbegin; i >= 0; i--)
      {

if (Kir<1)
{
Hi=Close[i];
Lo=Close[i];
Kir=1;
}


cur=(Close[i]);


if (cur > (Hi+KirPER * Point))
{
Kir=Kir+1;
Hi=cur;
Lo=cur-KirPER*Point;
KirUp=1;
KirDn=0;
kr=kr+1;
no=0;
}

if (cur < (Lo-KirPER*Point))
{
Lo=cur;
Hi=cur+KirPER*Point;
KirUp=0;
KirDn=1;
Kir=Kir+1;
no=no+1;
kr=0;
}

valueh=kr;
ExtMapBuffer1[i]=valueh;//XO up

if (valueh < 0)
{
ExtMapBuffer1[i] = 0;
}
if (valueh > 0)
{
ExtMapBuffer1[i] = 1;
}

valuel=0-no;
ExtMapBuffer2[i]=valuel;// XO down

if (valuel > 0)
{
ExtMapBuffer2[i] = 0;
}
if (valuel < 0)
{
ExtMapBuffer2[i] = -1;
}


}


//----
   return(0);
  }
//+------------------------------------------------------------------+
Comments