xxxxxxx
Download script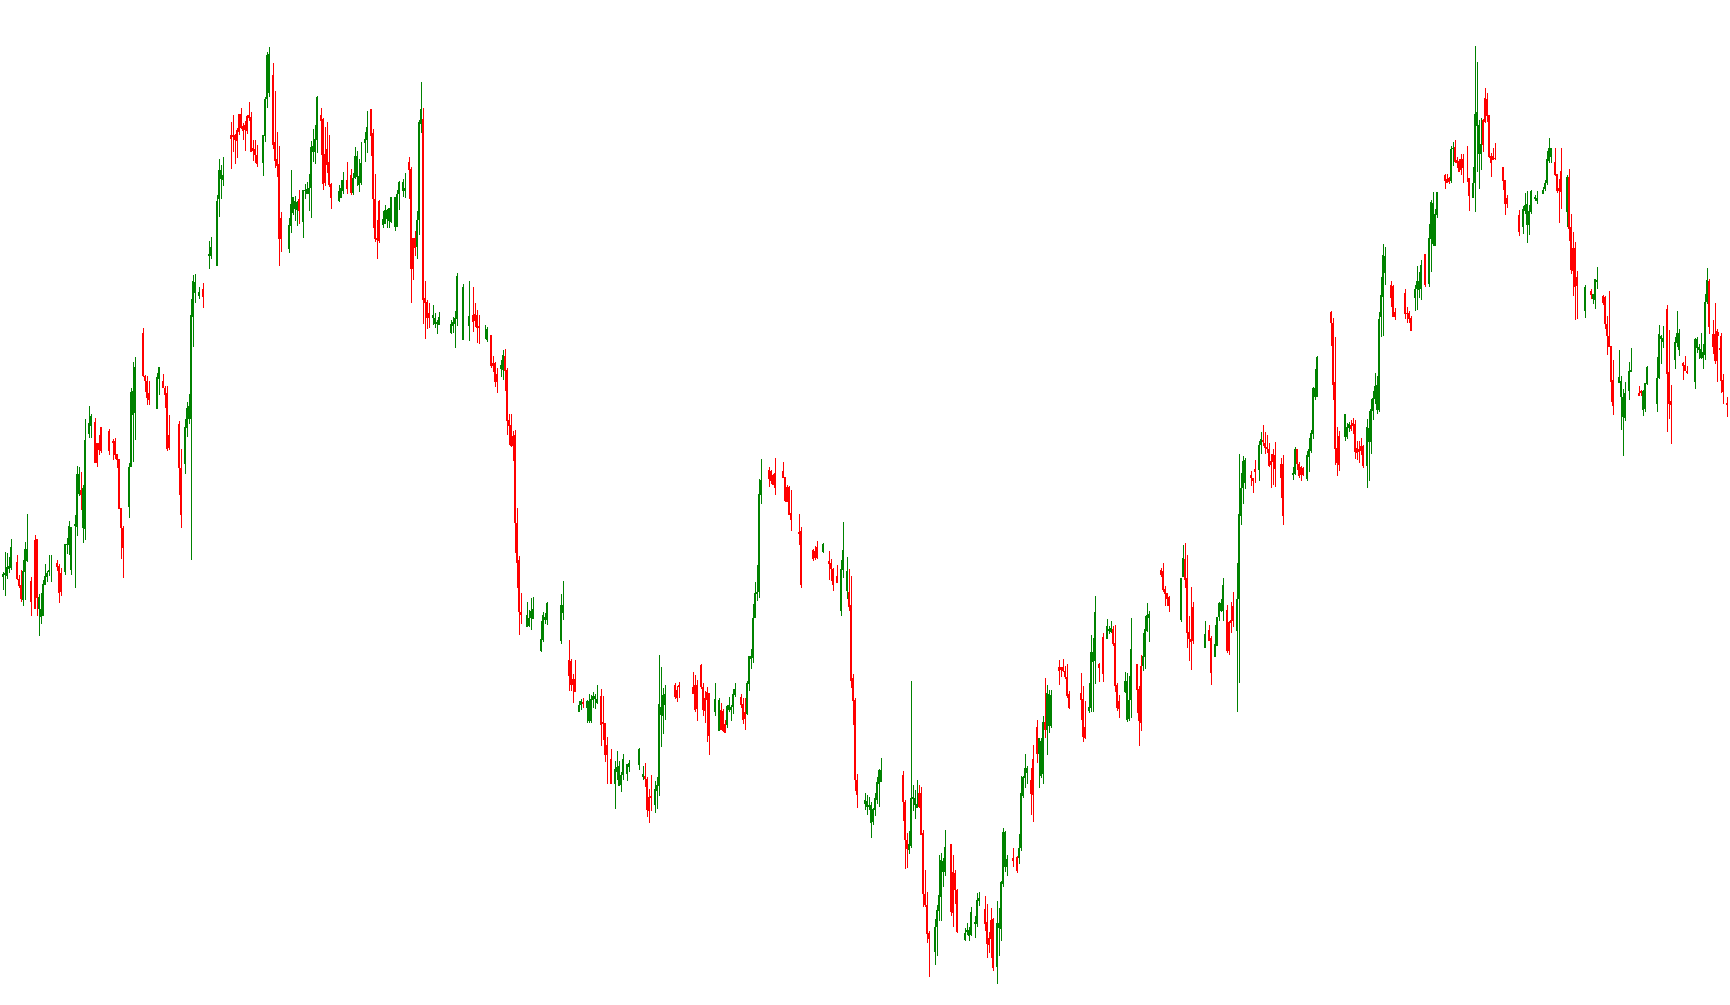
This tool is designed to provide a visual analysis of market price action by identifying specific "zones" based on the relationship between two technical momentum indicators: Awesome Clouds (AC) and Awesome Oscillators (AO). Instead of just showing simple lines, it maps out distinct visual areas on your chart to help distinguish between different types of market trends and price movements.
Core Logic and Detection
The script functions by constantly comparing the current values of the Awesome Cloud and Awesome Oscillator against their previous values. It classifies the market into three primary conditions based on whether these two indicators are moving in the same direction, opposite directions, or specific bullish/bearish configurations.
Visual Breakdown
The tool renders information using different colors and widths to represent "Bodies" (the main movement of the price) and "Shadows" (the extreme high/low reach).
-
Bullish Zones (Green): When both indicators signal a consistent upward trend, the script identifies these as primary bullish zones. It highlights the main body of the price candle in green. It also maps out the "shadows" to show the full range of the price movement during that period.
-
Bearish Zones (Red): Conversely, when both indicators signal a consistent downward trend, the script marks these as bearish zones. These are highlighted in red, helping you quickly identify periods where selling pressure is dominant across both momentum metrics.
-
Neutral/Mixed Zones (Gray): The script includes logic to identify "mixed" signals—situations where one indicator might be trending up while the other is trending down. These moments of uncertainty or transition are marked in gray. This helps filter out "noisy" data where there is no clear consensus between the two primary tools.
Summary for the Trader
Rather than forcing you to interpret two separate indicators manually, this script synthesizes that data into a single visual map. It effectively "filters" the price action:
- Agreement: When both indicators agree (Up/Up or Down/Down), it highlights the zone clearly in Green or Red.
- Disagreement: When the indicators conflict, it marks the zone in Gray, signaling that the market lacks a clear directional trend at that moment.
By using different widths for the "Body" and the "Shadow," the script allows you to see both the primary weight of the price movement and its volatility (the extremes) simultaneously, providing a more comprehensive view of the market's structural integrity.
//+------------------------------------------------------------------+
//|                                                    ZoneTrade.mq4 |
//|                                                           Duke3D |
//|                                             duke3datomic@mail.ru |
//+------------------------------------------------------------------+
#property copyright "Duke3D"
#property link      "duke3datomic@mail.ru"

#property indicator_chart_window
#property indicator_buffers 8
#property indicator_color1 Green
#property indicator_color2 Red
#property indicator_color3 Gray
#property indicator_color4 Gray
#property indicator_color5 Green
#property indicator_color6 Red
#property indicator_color7 Gray
#property indicator_color8 Gray

#property indicator_width1 3
#property indicator_width2 3
#property indicator_width3 3
#property indicator_width4 3
#property indicator_width5 1
#property indicator_width6 1
#property indicator_width7 1
#property indicator_width8 1

extern color GreenZone        = Green;          // ?â?? ç?ë¸??îé çî?û
extern color RedZone          = Red;            // ?â?? ê?à??îé çî?û
extern color GreyZone         = Gray;           // ?â?? ???îé çî?û
double AC_0;
double AC_1;
double AO_0;
double AO_1;
string name;
extern int BodyWidth          = 3;              // ?è?è?à ??ëà ?â?÷è
extern int ShadowWidth        = 1;              // ?è?è?à ???è ?â?÷è
//---- buffers
double ExtMapBuffer1[];
double ExtMapBuffer2[];
double ExtMapBuffer3[];
double ExtMapBuffer4[];
double ExtMapBuffer5[];
double ExtMapBuffer6[];
double ExtMapBuffer7[];
double ExtMapBuffer8[];
//----

//+------------------------------------------------------------------+
//| Custom indicator initialization function                         |
//+------------------------------------------------------------------+
int init()
  {
//---- indicators
   SetIndexStyle(0,DRAW_HISTOGRAM, 0, BodyWidth, GreenZone);
   SetIndexBuffer(0, ExtMapBuffer1);

   SetIndexStyle(1,DRAW_HISTOGRAM, 0, BodyWidth, RedZone);
   SetIndexBuffer(1, ExtMapBuffer2);

   SetIndexStyle(2,DRAW_HISTOGRAM, 0, BodyWidth, GreyZone);
   SetIndexBuffer(2, ExtMapBuffer3);

   SetIndexStyle(3,DRAW_HISTOGRAM, 0, BodyWidth, GreyZone);
   SetIndexBuffer(3, ExtMapBuffer4);

   SetIndexStyle(4,DRAW_HISTOGRAM, 0, ShadowWidth, GreenZone);
   SetIndexBuffer(4, ExtMapBuffer5);

   SetIndexStyle(5,DRAW_HISTOGRAM, 0, ShadowWidth, RedZone);
   SetIndexBuffer(5, ExtMapBuffer6);

   SetIndexStyle(6,DRAW_HISTOGRAM, 0, ShadowWidth, GreyZone);
   SetIndexBuffer(6, ExtMapBuffer7);

   SetIndexStyle(7,DRAW_HISTOGRAM, 0, ShadowWidth, GreyZone);
   SetIndexBuffer(7, ExtMapBuffer8);

//----
   SetIndexDrawBegin(0,10);
   SetIndexDrawBegin(1,10);
   SetIndexDrawBegin(2,10);
   SetIndexDrawBegin(3,10);
   SetIndexDrawBegin(4,10);
   SetIndexDrawBegin(5,10);
   SetIndexDrawBegin(6,10);
   SetIndexDrawBegin(7,10);
//---- initialization done
   return(0);
  }
//+------------------------------------------------------------------+
//| Custom indicator deinitialization function                       |
//+------------------------------------------------------------------+
int deinit()
  {
//----
//----
   return(0);
  }
//+------------------------------------------------------------------+
//| Custom indicator iteration function                              |
//+------------------------------------------------------------------+
int start()
  {
   int counted_bars=IndicatorCounted();
   int i, limit;
   double ZTOpen, ZTHigh, ZTLow, ZTClose;

   if(counted_bars > 0) counted_bars--;
   limit = Bars - counted_bars - 1;

   //for(limit=i; limit>0; limit--)
   while(limit>=0)
      {
      ZTOpen  = Open[limit];
      ZTHigh  = High[limit];
      ZTLow   = Low[limit];
      ZTClose = Close[limit];
//===================================================================================================================
      if(IndAC(limit)==1 && IndAO(limit)==1)            // C?ë¸?à? çî?à
        {
        if(Open[limit]>Close[limit])                    // bear
          {
           ExtMapBuffer1[limit] = ZTClose;
           ExtMapBuffer2[limit] = ZTOpen;
          }
        if(Open[limit]<Close[limit])                    // bull
          {
           ExtMapBuffer1[limit] = ZTOpen;
           ExtMapBuffer2[limit] = ZTClose;
          }
        ExtMapBuffer5[limit] = ZTLow;
        ExtMapBuffer6[limit] = ZTHigh;

        }
//===================================================================================================================
      if(IndAC(limit)==2 && IndAO(limit)==2)            // E?à??à? çî?à
        {
        if(Open[limit]>Close[limit])                    // bear
          {
           ExtMapBuffer1[limit] = ZTOpen;
           ExtMapBuffer2[limit] = ZTClose;
          }
        if(Open[limit]<Close[limit])                    // bull
          {
           ExtMapBuffer1[limit] = ZTClose;
           ExtMapBuffer2[limit] = ZTOpen;
          }
        ExtMapBuffer5[limit] = ZTHigh;
        ExtMapBuffer6[limit] = ZTLow;
        }
//===================================================================================================================
      if((IndAC(limit)==1 && IndAO(limit)==2) || (IndAC(limit)==2 && IndAO(limit)==1))            // ???à? çî?à
        {
        if(Open[limit]>Close[limit])                    // bear
          {
           ExtMapBuffer3[limit] = ZTClose;
           ExtMapBuffer4[limit] = ZTOpen;
          }
        if(Open[limit]<Close[limit])                    // bull
          {
           ExtMapBuffer3[limit] = ZTOpen;
           ExtMapBuffer4[limit] = ZTClose;
          }
        ExtMapBuffer7[limit] = ZTLow;
        ExtMapBuffer8[limit] = ZTHigh;
        }
      limit--;
      }
//===================================================================================================================
  return(0);
  }
//===================================================================================================================
int IndAC(int Shift)
   {
   int DirectionAC;
   AC_0 = iAC(Symbol(),0,Shift);
   AC_1 = iAC(Symbol(),0,Shift-1);
   if(AC_0>AC_1) {DirectionAC = 1;}               // C?ë¸?ûé ?à?
   if(AC_0<AC_1) {DirectionAC = 2;}               // E?à??ûé ?à?
   return(DirectionAC);
   }
//===================================================================================================================
int IndAO(int Shift)
   {
   int DirectionAO;
   AO_0 = iAO(Symbol(),0,Shift);
   AO_1 = iAO(Symbol(),0,Shift-1);
   if(AO_0>AO_1) {DirectionAO = 1;}               // C?ë¸?ûé ?à?
   if(AO_0<AO_1) {DirectionAO = 2;}               // E?à??ûé ?à?
   return(DirectionAO);
   }
//===================================================================================================================
Comments