XOAtr
Download script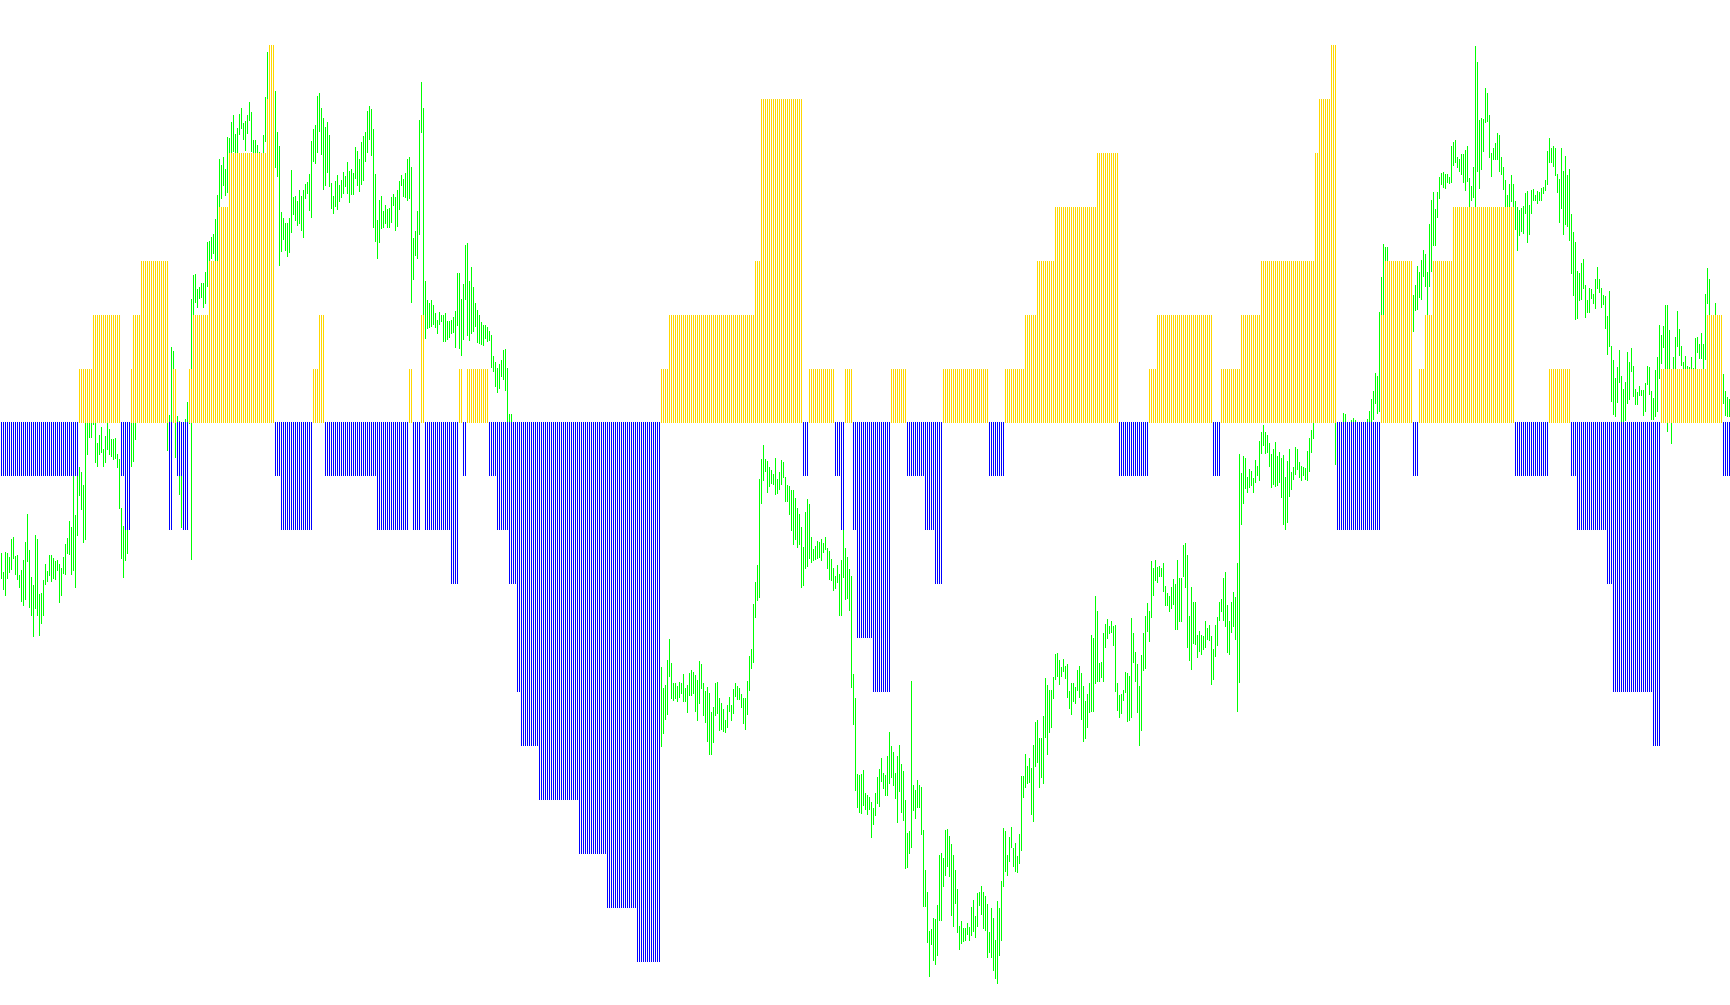
This technical indicator is designed to provide a visual representation of price momentum and market trend intensity by tracking "breakout" movements. Instead of simply showing price action, it monitors how significantly the market price deviates from established highs and lows relative to its recent volatility.
Core Logic Overview
The tool functions by establishing a dynamic "range" based on the current market volatility (using the Average True Range calculation). It essentially looks for moments where the price pushes outside of this expected range.
1. Establishing the Baseline The script continuously monitors the opening prices of candles to identify significant new peaks and troughs. It creates a boundary around these points. The width of this boundary is automatically adjusted based on how much the market is moving at that specific moment—meaning it reacts differently during calm periods compared to highly volatile sessions.
2. Identifying Momentum Breaks The logic triggers when the price moves beyond the established boundary in either direction:
- Upward Momentum: If the price rises significantly above the upper boundary, the script calculates the strength of this move. The further the price travels beyond the boundary, the higher the "momentum score" becomes.
- Downward Momentum: Conversely, if the price drops significantly below the lower boundary, the script captures this downward force and assigns it a corresponding value.
3. Visual Representation The indicator translates these momentum scores into two distinct visual elements on your chart:
- Positive Momentum (Bullish): When upward breaks occur, they are recorded as positive values and displayed as a histogram. The height of the bars represents how aggressively the price is pushing upward.
- Negative Momentum (Bearish): When downward breaks occur, they are recorded as negative values. These appear as a downward-reaching histogram, showing the intensity of the sell-off.
How to Interpret the Results
The indicator acts as a "velocity" tracker for price action. Rather than just telling you the price is going up or down, it highlights the intensity of the move.
- When you see tall bars in one direction, it indicates that the market is making significant structural breaks with high conviction.
- If the bars are small, it suggests that while the price may be moving, it isn't breaking out of its current volatility range with much strength.
- The script effectively "resets" its tracking points every time a new significant breakout occurs, ensuring that the logic is always adapting to the most recent market structure.
#property copyright "© 2003-2006 AINUR, RickD"


#property indicator_separate_window
#property indicator_buffers 2
#property indicator_color1 DodgerBlue
#property indicator_color2 Red


//extern int MaxBars = 1000;
extern int ATRPeriod = 14;

double buf1[];
double buf2[];

double hi, lo, kr, no, kk, kn;

//~~~~~~~~~~~~~~~~~~~~~~~~~~~~~~~~~~~~~~~~~~~~~~~~~~~~~~~~~~~~~~~~~~~~~~~~~~~~~~~~~~~~~~~~~~~~~~~

void init() {
  SetIndexBuffer(0, buf1);
  SetIndexBuffer(1, buf2);

  SetIndexStyle(0, DRAW_HISTOGRAM);
  SetIndexStyle(1, DRAW_HISTOGRAM);

  //SetIndexDrawBegin(0, Bars-MaxBars);
  //SetIndexDrawBegin(1, Bars-MaxBars);

  hi = 0;
  lo = 0;
  kr = 0;
  no = 0;
  kk = 0;
  kn = 0;
}


void start() {

  int counted = IndicatorCounted();
  if (counted < 0) return (-1);

  if (counted > 0) counted--;
  int limit = Bars-counted;
  limit = MathMin(limit, Bars-ATRPeriod);
  //limit = MathMin(limit, MaxBars);

  double ATR, cur;

  for (int i=limit; i >= 0; i--) {

    ATR = iATR(NULL, 0, ATRPeriod, i);
    cur = Open[i];

    if (hi == 0) hi = Open[i];
    if (lo == 0) lo = Open[i];


    if (cur > (hi+ATR)) {
      kk = MathCeil((cur-(hi+ATR))/ATR);
      //if (kk <= 1) kk = 1;
      hi = cur;
      lo = cur-ATR;
      kr = kr+kk;
      no = 0;
    }

    if (cur < (lo-ATR)) {
      kn = MathCeil(((lo-ATR)-cur)/ATR);
      //if (kn <= 1) kn = 1;
      lo = cur;
      hi = cur+ATR;
      no = no+kn;
      kr = 0;
    }

    buf1[i] = kr;
    buf2[i] = -no;
  }


}
Comments