Wilder_ADX_Crossing
Download script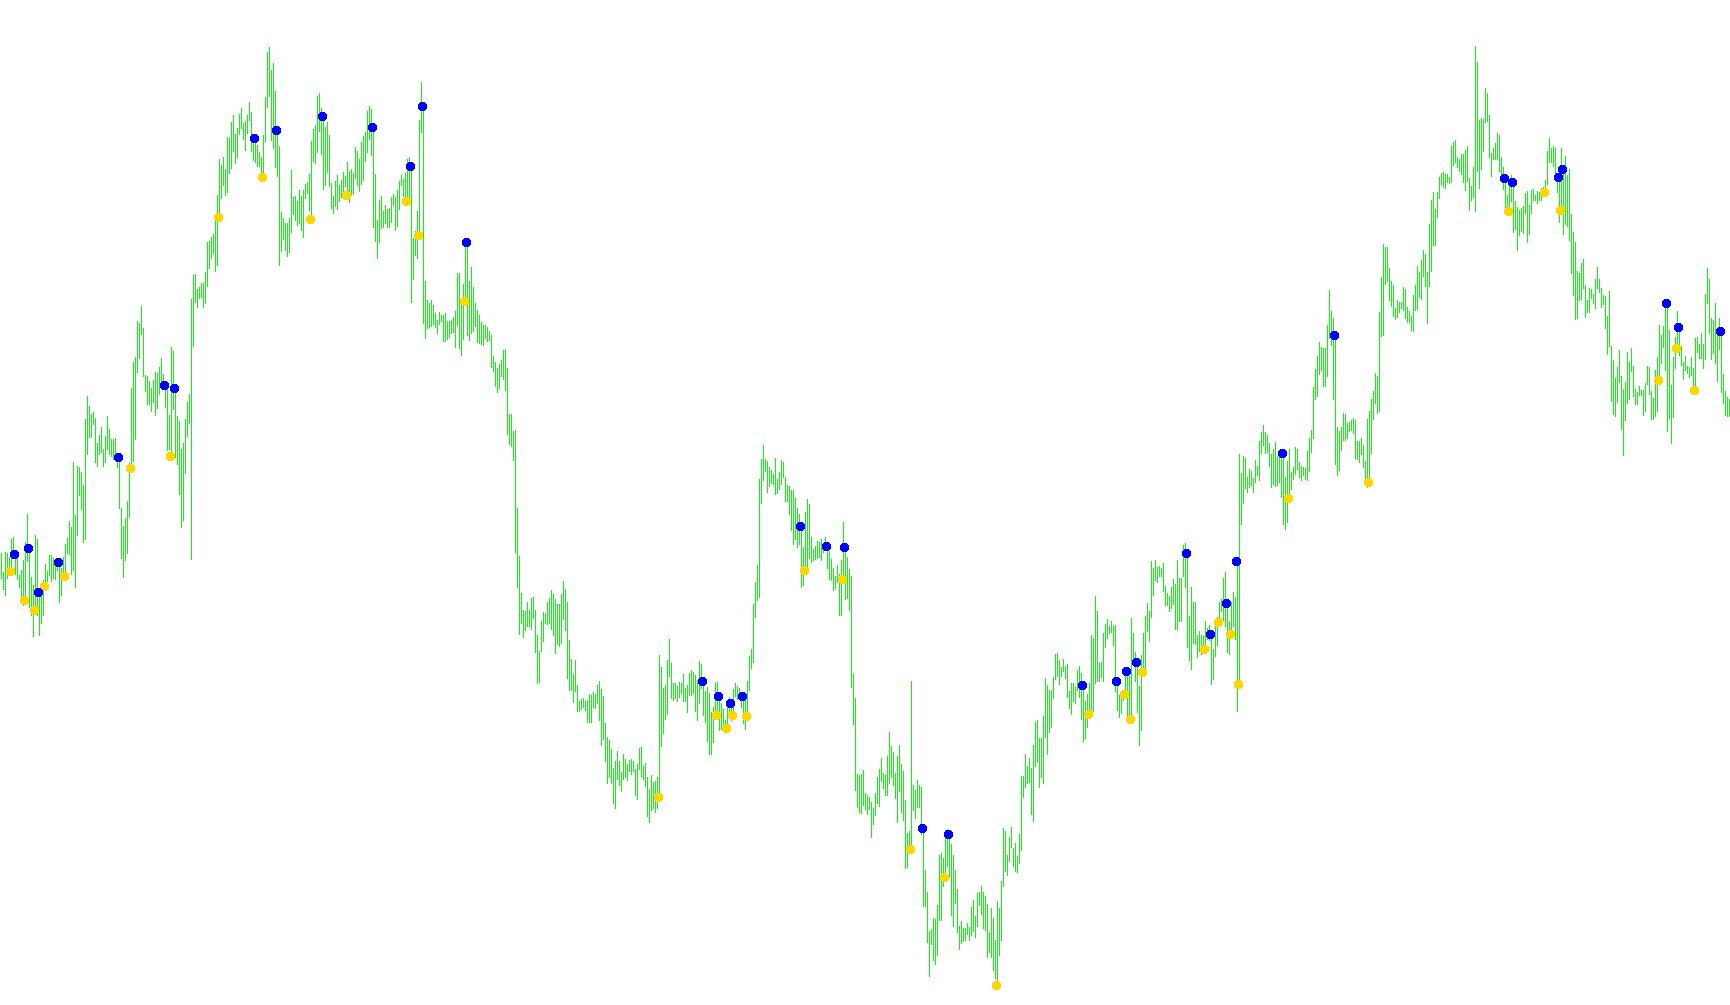
Overview of the Wilder ADX Cross Indicator
This script is designed as a visual trading tool that identifies specific turning points in market momentum. It acts as a signaling system by monitoring the relationship between two primary components of the "Directional Movement Index" (DMI), which is a popular technical analysis tool used to determine the strength and direction of a trend.
How the Logic Works
The core objective of this script is to detect "crossovers"—moments where the market sentiment shifts from one direction to another. To do this, the logic follows these steps:
1. Data Analysis The tool looks at two specific data streams:
- Plus DI (+DI): This represents the strength of upward (bullish) price movement.
- Minus DI (-DI): This represents the strength of downward (bearish) price movement.
2. Comparing Past and Present States The script constantly compares the values of these two streams at two different points in time: the previous candle (the past) and the current candle (the present). It is looking for a specific "cross" to occur between these two lines.
3. Signal Generation The script places visual markers on your chart based on the following conditions:
- Bullish Signal (Buy/Upward): If, in the previous candle, the downward strength was higher than the upward strength, but in the current candle, the upward strength has moved above the downward strength, the script identifies a crossover. It then places a visual marker just below the low price of that candle.
- Bearish Signal (Sell/Downward): Conversely, if, in the previous candle, the upward strength was higher than the downward strength, but in the current candle, the downward strength has moved above the upward strength, it identifies a reversal. It then places a visual marker just above the high price of that candle.
Summary for Traders
Instead of requiring you to manually watch complex moving lines, this script automates the detection of trend shifts. When the "Plus" and "Minus" indicators cross each other, the script paints a dot or arrow on your chart, providing a clear visual cue that the market momentum may be changing from bearish to bullish, or vice versa.
//+------------------------------------------------------------------+
//| Wilder ADX Cross.mq4                                             |
//| Amir code baded                                                  |
//+------------------------------------------------------------------+
#property  copyright ""

#property indicator_chart_window
#property indicator_buffers 2
#property indicator_color1 Blue
#property indicator_width1 2
#property indicator_color2 Tomato
#property indicator_width2 2

//---- input parameters
extern int       MA_Length    =  1; // Period of additional smoothing
extern int       DMI_Length   = 14; // Period of DMI
extern int       ADX_Length   = 14; // Period of ADX
extern int       ADXR_Length  = 14; // Period of ADXR
extern int CountBars=2600;

//---- buffers
double val1[];
double val2[];
double b4plusdi,nowplusdi,b4minusdi,nowminusdi;

//+------------------------------------------------------------------+
//| Custom indicator initialization function                         |
//+------------------------------------------------------------------+
int init()
  {
   string short_name;
//---- indicator line
   IndicatorBuffers(2);
   SetIndexStyle(0,DRAW_ARROW);
   SetIndexArrow(0,108);
   SetIndexStyle(1,DRAW_ARROW);
   SetIndexArrow(1,108);
   SetIndexBuffer(0,val1);
   SetIndexBuffer(1,val2);
//----
   return(0);
  }
//+------------------------------------------------------------------+
//|                                                                  |
//+------------------------------------------------------------------+
int start()
  {
   if (CountBars>=Bars) CountBars=Bars;
   SetIndexDrawBegin(0,Bars-CountBars);
   SetIndexDrawBegin(1,Bars-CountBars);
   int i,shift,counted_bars=IndicatorCounted();


   //---- check for possible errors
   if(counted_bars<0) return(-1);

   //---- initial zero
   if(counted_bars<1)
     {
      for(i=1;i<=CountBars;i++) val1[CountBars-i]=0.0;
      for(i=1;i<=CountBars;i++) val2[CountBars-i]=0.0;
     }

for (shift = CountBars; shift>=0; shift--)
{

	b4plusdi=iCustom(NULL,0,"WildersDMI_v1.1",MA_Length,DMI_Length,ADX_Length,ADXR_Length,1,shift+1);
	nowplusdi=iCustom(NULL,0,"WildersDMI_v1.1",MA_Length,DMI_Length,ADX_Length,ADXR_Length,1,shift);
	b4minusdi=iCustom(NULL,0,"WildersDMI_v1.1",MA_Length,DMI_Length,ADX_Length,ADXR_Length,2,shift+1);
	nowminusdi=iCustom(NULL,0,"WildersDMI_v1.1",MA_Length,DMI_Length,ADX_Length,ADXR_Length,2,shift);

if (b4plusdi<b4minusdi && nowplusdi>nowminusdi)
{
	val1[shift]=Low[shift]-5*Point;
}
if (b4plusdi>b4minusdi && nowplusdi<nowminusdi)
{
	val2[shift]=High[shift]+5*Point;
}


}
   return(0);
  }
//+-------------------------------------------------------------------------------------+
Comments