Wilder Volatility System
Download script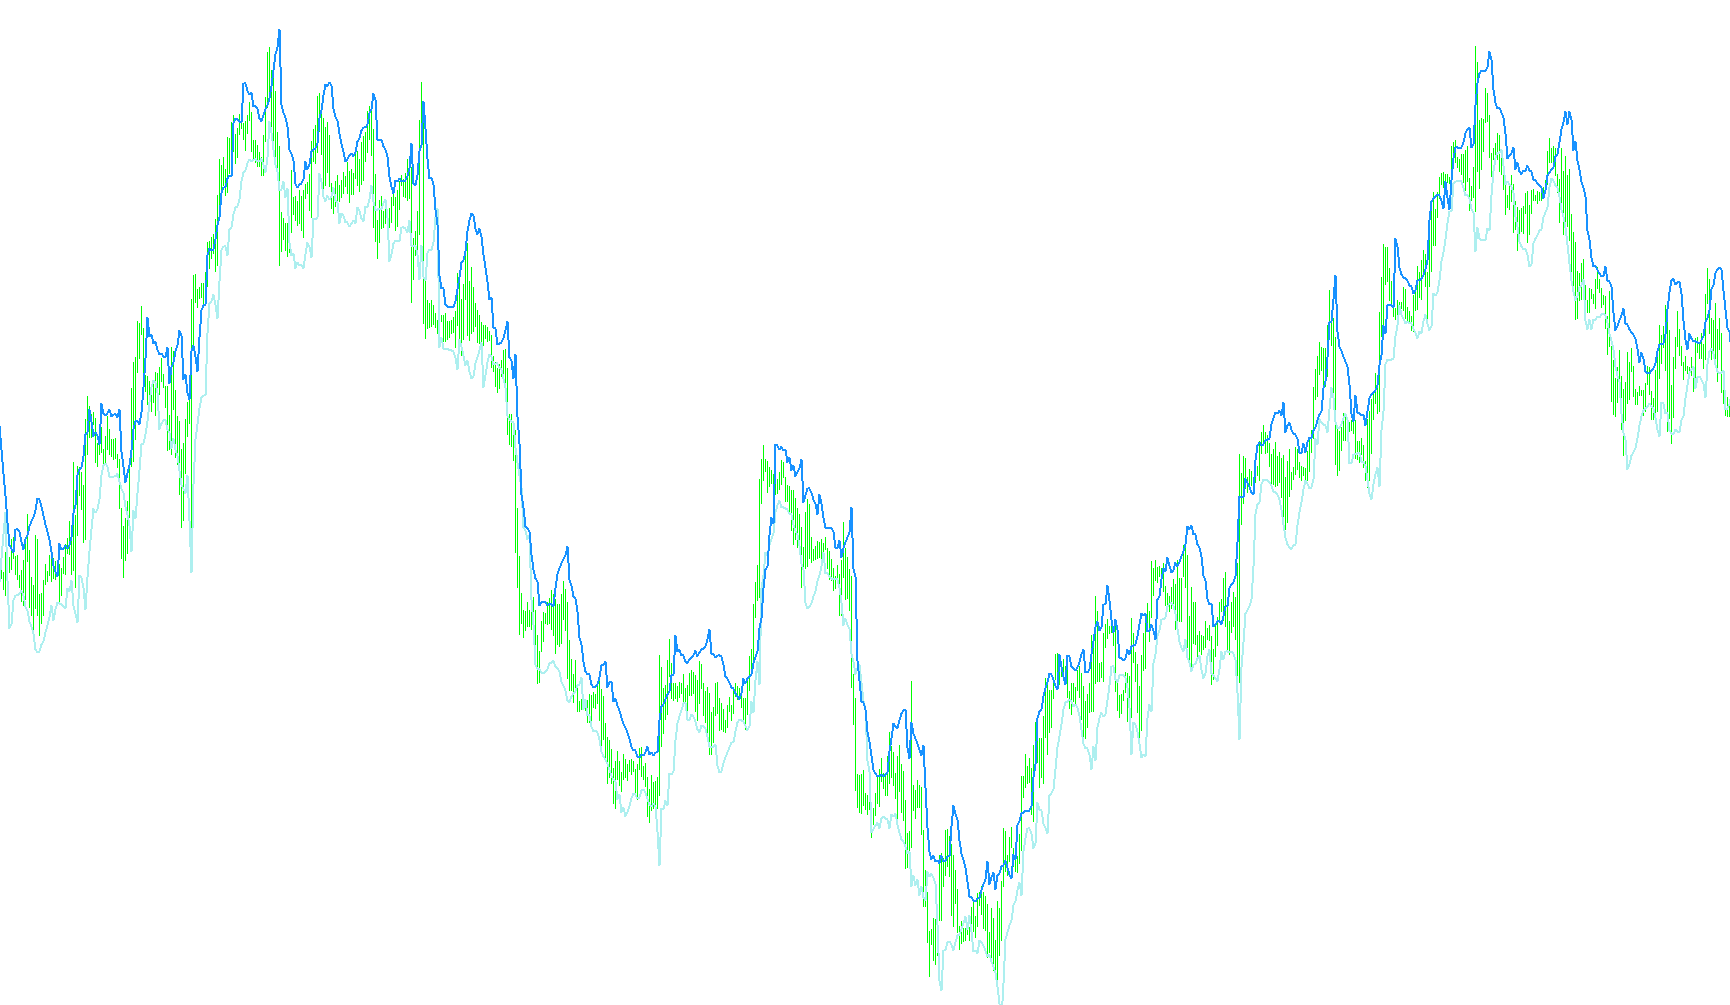
The Wilder Volatility System is a technical analysis tool designed to help traders visualize market price boundaries and identify potential trend shifts based on price action and volatility. It functions by creating a dynamic "channel" around the current market price, providing a clearer picture of where the market is currently trading in relation to its recent highs and lows.
How it Works
The logic behind this script focuses on two primary components: Price Extremes and Volatility Measurement.
- Identifying Key Levels: The system looks back over a specific period (defined by the "Range" parameter) to find the highest and lowest closing prices reached in that timeframe. These points serve as the anchor for its calculations.
- Dynamic Channeling: Instead of using a static line, the script calculates an upper and lower boundary. It takes those extreme price points and adjusts them based on the Average True Range (ATR)—a standard measure of market volatility. By multiplying this volatility factor, the system creates a "buffer zone" or channel. This ensures that the boundaries expand when the market is moving wildly and contract when the market is stable.
Visual Elements
The script provides several visual aids to help with chart interpretation:
- The Channels: When enabled, the tool draws two distinct lines on your chart. These represent the calculated upper and lower volatility boundaries. They act as a visual "tunnel" for the price; as long as the price stays within these lines, it is moving within its normal expected range.
- Trend Identification: The logic includes a framework to identify whether the market is currently in an "Up trend" or a "Down trend." It does this by comparing the current closing price against the calculated boundaries and extremes.
- Customizable Signals: The system allows users to choose how they want to view these signals, such as highlighting specific points on the chart when the price breaks out of its established volatility range.
Practical Application
For a trader, this tool is designed to filter out "noise." By visualizing the market's expected range based on recent history and current volatility, it helps in identifying whether a price movement is a significant breakout or simply standard market fluctuation. It provides a structured way to see where the market "should" be trading at any given moment.
//+------------------------------------------------------------------+
//|                                     Wilder Volatility System.mq4 |
//|                      Copyright © 2006, MetaQuotes Software Corp. |
//|                                        http://www.metaquotes.net |
//+------------------------------------------------------------------+

#property indicator_chart_window
#property indicator_buffers 4
#property indicator_color1 Red
#property indicator_color2 Blue
#property indicator_color3 Tomato
#property indicator_color4 DeepSkyBlue


//---- input parameters //îáúÿâëåíèå ââîäèìûõ âíåøíèõ ïàðàìåòðîâ
extern int Range = 7;
extern bool Chanel = true;//Ðèñóåì êàíàëû
extern bool Znachjk = true;// Åñëè true òî ðèñóåì çíà÷êè íàä Õàåì èëè ïîä Ëîó
                           // â ïðîòèâíîì ñëó÷àå íà ãðàíèöå êàíàëà
//---- buffers
double UpBuffer[];
double DnBuffer[];
double ChanelUp[];
double ChanelDn[];


//+------------------------------------------------------------------+
//| Custom indicator initialization function                         |
//+------------------------------------------------------------------+
int init() //èíèöèàëèçàöèÿ ïåðåìåííûõ
  {

//---- indicator line

   SetIndexStyle(0,DRAW_ARROW);
   SetIndexArrow(0,251);
   SetIndexBuffer(0,UpBuffer);
   SetIndexEmptyValue(0,0.0);

   SetIndexStyle(1,DRAW_ARROW);
   SetIndexArrow(1,251);
   SetIndexBuffer(1,DnBuffer);
   SetIndexEmptyValue(1,0.0);

   SetIndexStyle(2,DRAW_LINE,0,2);
   SetIndexStyle(3,DRAW_LINE,0,2);
   SetIndexBuffer(2,ChanelUp);
   SetIndexBuffer(3,ChanelDn);
   SetIndexDrawBegin(2,0); //óñòàíîâêà íà÷àëüíîé òî÷êè ïðîðèñîâêè äëÿ 0 áóôåðà
   SetIndexDrawBegin(3,0); //óñòàíîâêà íà÷àëüíîé òî÷êè ïðîðèñîâêè äëÿ 1 áóôåðà
//----
   return(0); //âîçâðàò èç ñåêöèè èíèöèàëèçàöèè
  }
//+------------------------------------------------------------------+
//| PriceChannel                                                     |
//+------------------------------------------------------------------+
int start() //íà÷àëî ïðîãðàììû (ðàñ÷åòà)
  {
   int i; //îáúÿâëåíèå öåëî÷èñëåííîé ïåðåìåííîé i,k,sch
   double Up_Chanel, Dn_Chanel,H_Range,L_Range,H,L;
   int H_R,L_R;

   for(i=Bars-1;i>=0;i--)
   {
      H_R = iHighest(NULL,0,MODE_CLOSE,Range+1,i+1);
      L_R = iLowest(NULL,0,MODE_CLOSE,Range+1,i+1);
      H_Range = Close[H_R];
      L_Range = Close[L_R];
      Up_Chanel = Close[H_R] - 2*iATR(NULL,0,Range+1,i);
      Dn_Chanel = Close[L_R] + 2*iATR(NULL,0,Range+1,i);
      H=High[i];
      L=Low[i];


      if(Chanel == true) // Ðèñóåì êàíàëû, åñëè íàäî :)
      {
         ChanelUp[i] = Up_Chanel;
         ChanelDn[i] = Dn_Chanel;
      }

  /*
      if(Znachjk == true)//Ðèñóåì çíà÷åê íàä õàåì èëè ëîó òåêóùåãî áàðà
      {
         if (Close[i] > Up_Chanel) //H_Range)
         {
             Comment("Up trend");
             UpBuffer[i] = EMPTY_VALUE;
             DnBuffer[i] = L;//Dn_Chanel;
             ChanelUp[i] = EMPTY_VALUE;
             ChanelDn[i] = Dn_Chanel;
         }
         if (Close[i] < Dn_Chanel) //L_Range)// ???? Âîçìîæíî èìåëîñü ââèäó Close[i] < H_Range  ???????
         {
             Comment("Down trend");
             UpBuffer[i] = H;//Up_Chanel;
             DnBuffer[i] = EMPTY_VALUE;
             ChanelUp[i] = Up_Chanel;
             ChanelDn[i] = EMPTY_VALUE;
         }
       }
       else//Ðèñóåì çíà÷åê íà ãðàíèöå êàíàëà
       {
         if (Close[i] > H_Range)
         {
             Comment("Up trend");
             UpBuffer[i] = EMPTY_VALUE;
             DnBuffer[i] = Dn_Chanel;
         }
         if (Close[i] < L_Range)// ???? Âîçìîæíî èìåëîñü ââèäó Close[i] < H_Range  ???????
         {
             Comment("Down trend");
             UpBuffer[i] = Up_Chanel;
             DnBuffer[i] = EMPTY_VALUE;
         }
       }
      */
   }

   return(0);
  }
//+------------------------------------------------------------------+
Comments