wellxAMA
Download script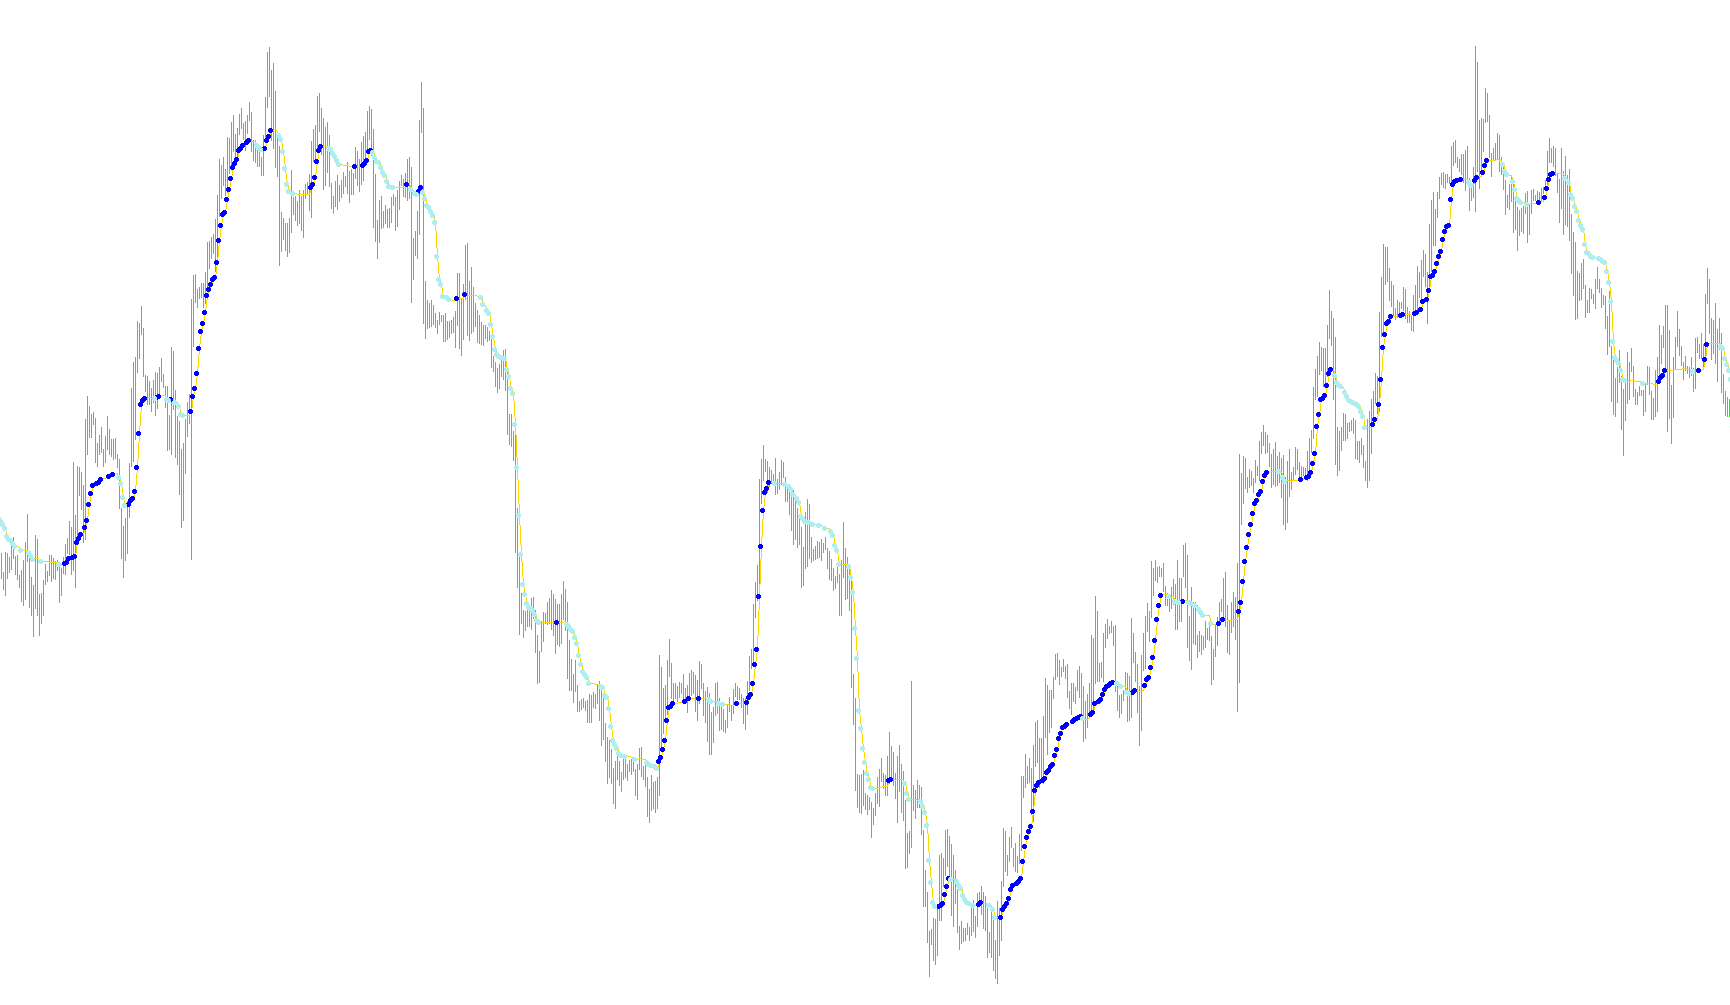
This script is a technical trading indicator designed to help traders identify and follow market trends by filtering out "market noise." Instead of showing every minor price fluctuation, it uses a sophisticated mathematical approach to determine the underlying direction of the price movement.
Core Logic Overview
The primary goal of this tool is to distinguish between significant trend movements and insignificant price vibrations. It achieves this through a three-step logical process:
1. Measuring Market Noise vs. Signal The script first looks at a specific window of time (defined by the user as the period). Within this window, it calculates two different values:
- The Signal: The total distance between the price at the beginning and the end of the period.
- The Noise: The sum of all the small price movements that occurred during that same period.
By comparing these two, the script calculates an "Efficiency Ratio." If the price moved a lot but stayed in one direction, the noise is low and the signal is high. If the price jumped around significantly but ended up near where it started, the noise is high and the signal is low.
2. Dynamic Trend Smoothing Once the efficiency of the move is determined, the script applies a smoothing calculation. It uses two different "speeds" (Fast and Slow) to adjust how quickly the indicator reacts to new data.
- In a very efficient, clear trend, the indicator will lean toward the "fast" speed to capture the movement early.
- In a choppy, messy market where there is little clear direction, it leans toward the "slow" speed to prevent the trader from being tricked by false movements.
3. Visual Identification of Trend Shifts The final output of the script is a smooth line on the chart that represents the calculated trend. To make this actionable for a trader, the logic also includes an automated alert system:
- Upward Signals: When the trend line moves upward beyond a specific sensitivity threshold, the script identifies a potential "buy" or bullish movement.
- Downward Signals: When the trend line drops below that same threshold, it identifies a potential "sell" or bearish movement.
Summary for the User
Essentially, this tool acts as a filter. It looks at the "quality" of price movement—ignoring the frantic ups and downs of a sideways market—and highlights when the price begins to move with consistent, efficient momentum in a single direction. It aims to provide a cleaner visual path of where the market is heading rather than showing the "jitter" of every individual price tick.
//+------------------------------------------------------------------+
//|                                                      Kaufman.mq4 |
//|                             Copyright © -2005, by konKop & wellx |
//|                                        http://www.metaquotes.net |
//+------------------------------------------------------------------+
#property copyright "Copyright © 2004, by konKop,wellx"
#property link      "http://www.metaquotes.net"

#property indicator_chart_window
#property indicator_buffers 3
#property indicator_color1 Sienna
#property indicator_color2 DeepSkyBlue
#property indicator_color3 Gold

//---- input parameters
extern int       periodAMA=9;
extern int       nfast=2;
extern int       nslow=30;
extern double    G=2.0;
extern double    dK=2.0;

//---- buffers
double kAMAbuffer[];
double kAMAupsig[];
double kAMAdownsig[];

//+------------------------------------------------------------------+

int    cbars=0, prevbars=0, prevtime=0;
double slowSC,fastSC;

//+------------------------------------------------------------------+
//| Custom indicator initialization function                         |
//+------------------------------------------------------------------+
int init()
  {
//---- indicators
   SetIndexStyle(0,DRAW_LINE);
   SetIndexStyle(1,DRAW_ARROW);
   SetIndexArrow(1,159);
   SetIndexStyle(2,DRAW_ARROW);
   SetIndexArrow(2,159);
   SetIndexBuffer(0,kAMAbuffer);
   SetIndexBuffer(1,kAMAupsig);
   SetIndexBuffer(2,kAMAdownsig);


   IndicatorDigits(4);

//----
   return(0);
  }
//+------------------------------------------------------------------+
//| Custom indicator deinitialization function                       |
//+------------------------------------------------------------------+
int deinit()
  {
   return(0);
  }
//+------------------------------------------------------------------+
//| Custom indicator iteration function                              |
//+------------------------------------------------------------------+
int start()
  {
   int    i,pos=0;
   double noise=0.000000001,AMA,AMA0,signal,ER;
   double dSC,ERSC,SSC,ddK;

   if (prevbars==Bars) return(0);

//---- TODO: add your code here
   slowSC=(2.0 /(nslow+1));
   fastSC=(2.0 /(nfast+1));
   cbars=IndicatorCounted();
   if (Bars<=(periodAMA+2)) return(0);
//---- check for possible errors
   if (cbars<0) return(-1);
//---- last counted bar will be recounted
   if (cbars>0) cbars--;
   pos=Bars-periodAMA-2;
   AMA0=Close[pos+1];
   while (pos>=0)
     {
      if(pos==Bars-periodAMA-2) AMA0=Close[pos+1];
      signal=MathAbs(Close[pos]-Close[pos+periodAMA]);
      noise=0.000000001;
      for(i=0;i<periodAMA;i++)
       {
        noise=noise+MathAbs(Close[pos+i]-Close[pos+i+1]);
       };
      ER =signal/noise;
      dSC=(fastSC-slowSC);
      ERSC=ER*dSC;
      SSC=ERSC+slowSC;
      AMA=AMA0+(MathPow(SSC,G)*(Close[pos]-AMA0));
      kAMAbuffer[pos]=AMA;

      ddK=(AMA-AMA0);
      if ((MathAbs(ddK)) > (dK*Point) && (ddK > 0)) kAMAupsig[pos]  =AMA;
      if ((MathAbs(ddK)) > (dK*Point) && (ddK < 0)) kAMAdownsig[pos]=AMA;

      AMA0=AMA;
      pos--;
     };
//----
   prevbars=Bars;
   return(0);
  }
Comments