weekly_high_low- LA
Download script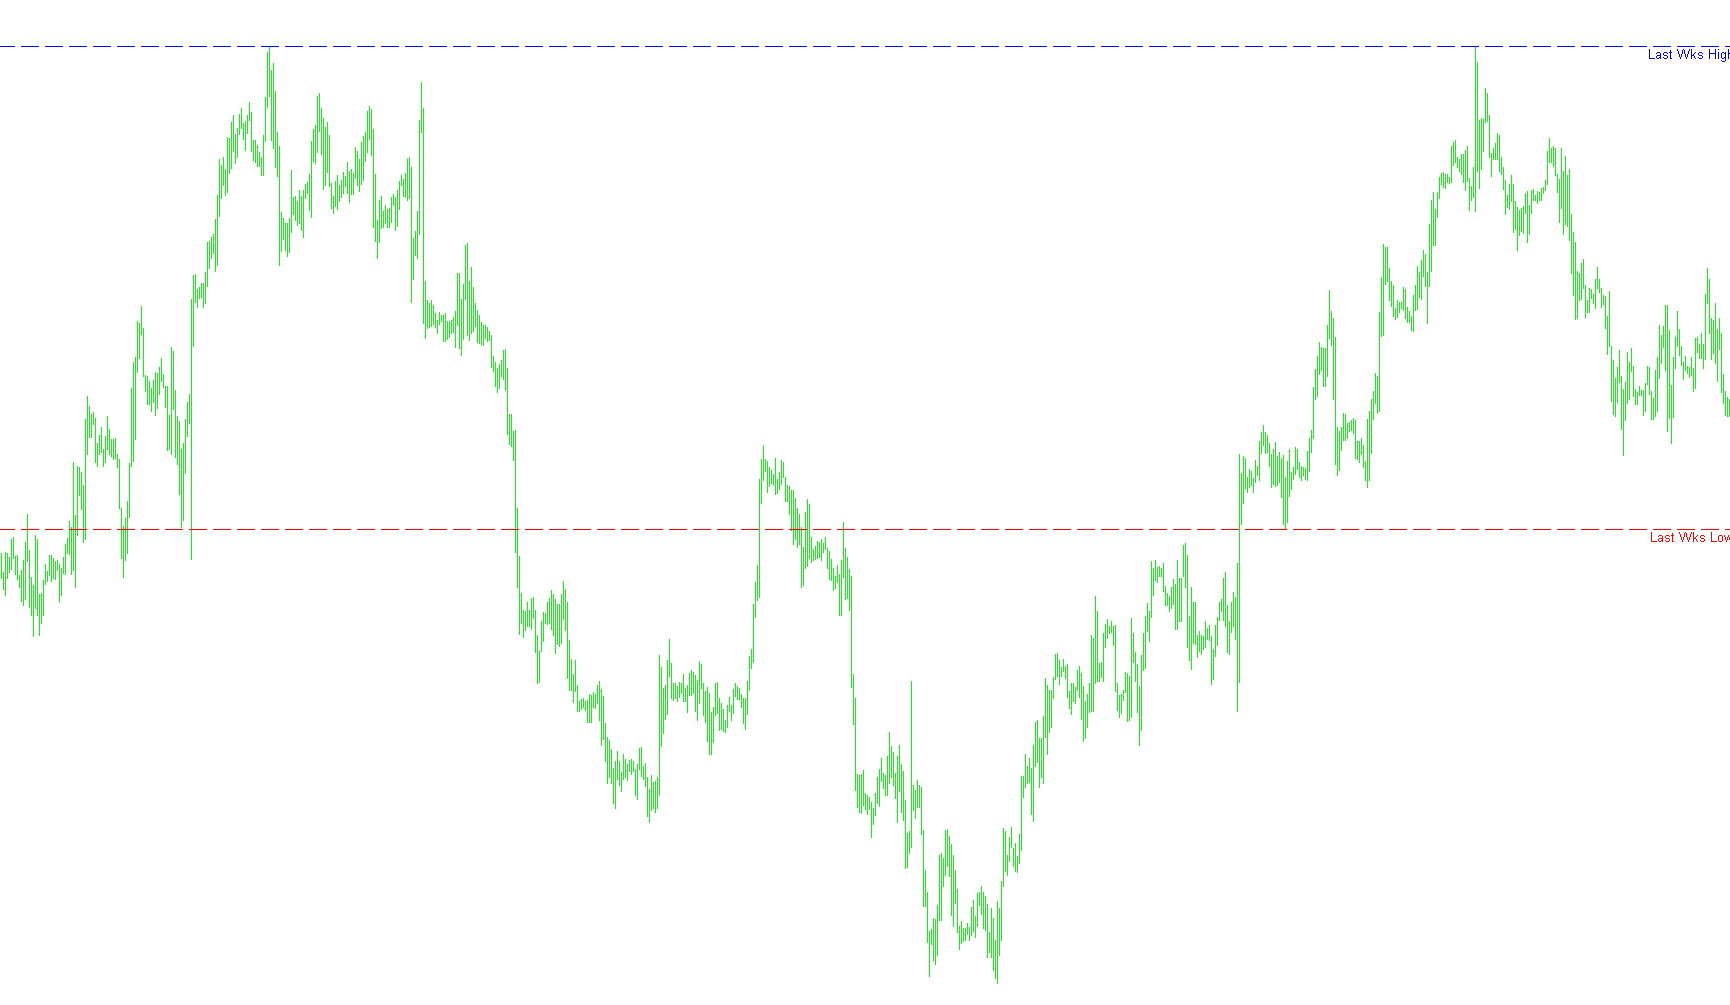
This script is designed to provide traders with a clear visual reference of previous market activity by automatically identifying and displaying the price extremes from the prior week. By highlighting these specific levels, it helps traders understand historical boundaries that may act as significant support or resistance zones in current market conditions.
How the Logic Works
Data Retrieval The script begins by scanning the historical data of the specific currency pair or asset you are viewing. It specifically looks back at the "Weekly" timeframe to isolate the completed week immediately preceding the current one.
Identifying Key Levels Once it has accessed the previous week's data, the logic identifies two primary figures:
- The Weekly High: The highest price reached during the last seven days of trading.
- The Weekly Low: The lowest price reached during that same period.
Visual Mapping Rather than just providing these numbers in a list, the script actively draws them onto your active trading chart in real-time:
- Dynamic Lines: It creates two horizontal dashed lines across your screen. These lines move automatically to stay perfectly aligned with the previous week's high and low prices as they are calculated.
- Color Coding: To make the chart easy to read at a glance, it uses color differentiation—typically blue for the high point and red for the low point.
- Text Labels: The script places text labels on the chart (e.g., "Last Wks High") next to these lines, ensuring you always know exactly which price level you are looking at without having to hover your mouse over the data.
Automated Updates The script is designed to be "live." Every time the market moves or a new price update occurs, the script refreshes its calculations. This ensures that as soon as a new week begins, the lines automatically shift to reflect the completed high and low of the week that just ended.
//+------------------------------------------------------------------+
//|                                               Daily_High_Low.mq4 |
//|                                       Copyright © Terry Nicholls |
//+------------------------------------------------------------------+
//+------------------------------------------------------------------+
//|Updated code to reflect Weekly high/low  - Steve Fleming          |
//|Free e-course teaching you how to write your own EA. No previous  |
//|programming skills needed.                                        |
//|http://www.automatedtradingsoftware.com                           |
//+------------------------------------------------------------------+
#property copyright "Copyright © Terry Nicholls"

// Parameters

#property indicator_chart_window

extern int TimeZoneOfData = 0; // GMT

double lastweek_high=0;
double lastweek_low=0;

double rates_d1[2][6];
double wklyh;
double wklyl;

//+------------------------------------------------------------------+
//| Custom indicator initialization function                         |
//+------------------------------------------------------------------+

int init()
  {

// Indicators

wklyh=0; wklyl=0;

   return(0);
  }

//+------------------------------------------------------------------+
//| Custom indicator deinitialization function                       |
//+------------------------------------------------------------------+

int deinit()
  {

ObjectDelete("wklyh Label");
ObjectDelete("wklyh Line");
ObjectDelete("wklyl Label");
ObjectDelete("wklyl Line");

   return(0);
  }

//+------------------------------------------------------------------+
//| Custom indicator iteration function                              |
//+------------------------------------------------------------------+

int start()
  {

// Get new Daily prices

ArrayCopyRates(rates_d1, Symbol(), PERIOD_W1);

lastweek_high = rates_d1[1][3];
lastweek_low = rates_d1[1][2];

// Calculate Daily High/Low lines

wklyh = lastweek_high;
wklyl = lastweek_low;

// Uncomment the line below to display the data at the top of your chart

// Comment ("Yesterday's High = ",lastweek_high,"  Yesterday's Low = ",lastweek_low);

// Set Daily High/Low line labels on chart window

      if(ObjectFind("wklyh label") != 0)
      {
      ObjectCreate("wklyh label", OBJ_TEXT, 0, Time[20], wklyh);
      ObjectSetText("wklyh label", "Last Wks High", 10, "Arial", Blue);
      }
      else
      {
      ObjectMove("wklyh label", 0, Time[20], wklyh);
      }

      if(ObjectFind("wklyl label") != 0)
      {
      ObjectCreate("wklyl label", OBJ_TEXT, 0, Time[20], wklyl);
      ObjectSetText("wklyl label", "Last Wks Low", 10, "Arial", Red);
      }
      else
      {
      ObjectMove("wklyl label", 0, Time[20], wklyl);
      }

// Draw Yesterday's High/Low lines on chart

      if(ObjectFind("wklyh line") != 0)
      {
      ObjectCreate("wklyh line", OBJ_HLINE, 0, Time[40], wklyh);
      ObjectSet("wklyh line", OBJPROP_STYLE, STYLE_DASH);
      ObjectSet("wklyh line", OBJPROP_WIDTH,0 );
      ObjectSet("wklyh line", OBJPROP_COLOR, Blue);
      //Alert("Daily Low" ,Symbol()," ",Period()," @ ",Bid);PlaySound("sound7.wav");
      }
      else
      {
      ObjectMove("wklyh line", 0, Time[40], wklyh);
      }

      if(ObjectFind("wklyl line") != 0)
      {
      ObjectCreate("wklyl line", OBJ_HLINE, 0, Time[40], wklyl);
      ObjectSet("wklyl line", OBJPROP_STYLE, STYLE_DASH);
      ObjectSet("wklyl line", OBJPROP_WIDTH, 0);
      ObjectSet("wklyl line", OBJPROP_COLOR, Red);
      //Alert("Daily High" ,Symbol()," ",Period()," @ ",Bid);PlaySound("sound7.wav");
      }
      else
      {
      ObjectMove("wklyl line", 0, Time[40], wklyl);
      }

   return(0); // End program

  }

//+------------------------------------------------------------------+
Comments