T3_iAnchMom_hist_v1
Download script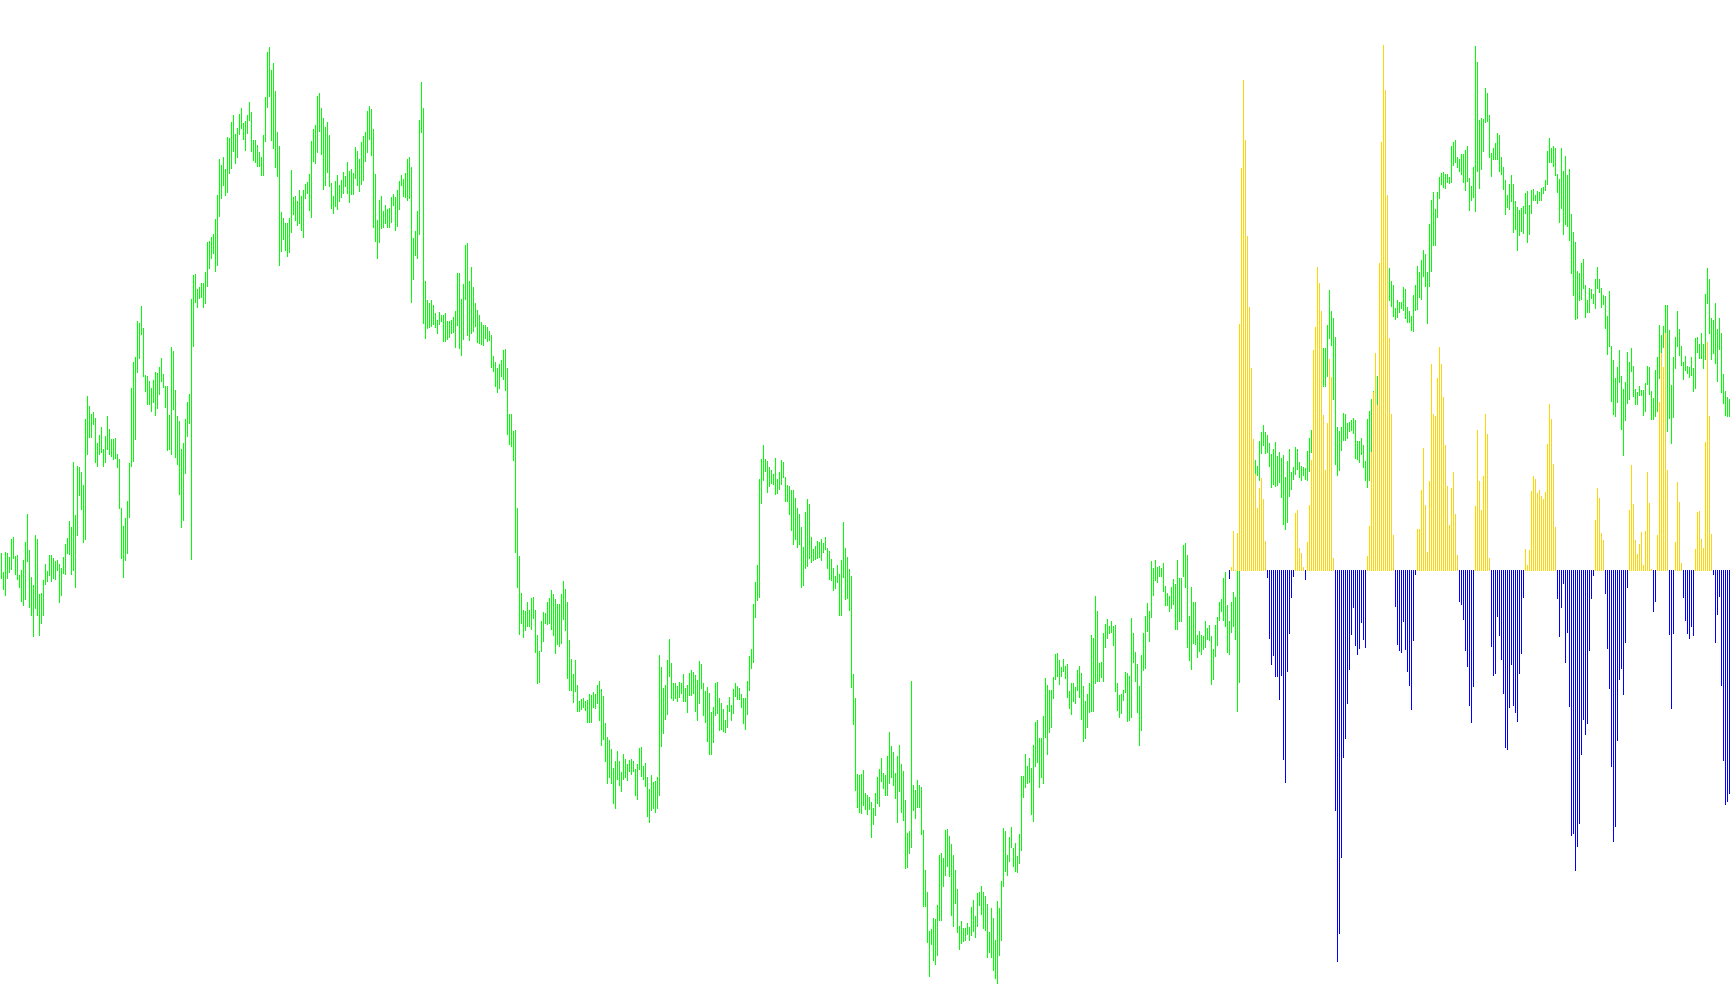
This technical indicator is designed to provide traders with a visual representation of market momentum by analyzing the relationship between two distinct price smoothing techniques. Rather than simply looking at raw price action, it processes data through a sophisticated mathematical filter to highlight the speed and direction of market trends.
Core Methodology
The script operates by calculating two different types of "smoothed" price averages simultaneously:
- Advanced Smoothing (T3): The tool utilizes a specific type of moving average known for reducing "noise" while maintaining high sensitivity to actual price movements. It uses a multi-layered calculation (passing the price through several successive smoothing stages) to create a more refined view of the trend than a standard moving average could provide.
- Momentum Analysis: The script then compares these smoothed values against each other. By measuring the difference between the two primary data streams, it determines whether the market's current momentum is accelerating or decelerating.
Visual Representation
The indicator outputs its findings in a separate window below the main price chart as a histogram:
- Upward Momentum (Green/LightSeaGreen): When the calculated momentum is positive, the histogram bars rise above the zero line. This suggests that the primary trend is gaining strength in an upward direction.
- Downward Momentum (Red/FireBrick): When the calculated momentum turns negative, the bars drop below the zero line. This signals that the trend is shifting or gaining strength in a downward direction.
How to Interpret the Data
By observing the height and direction of the histogram bars, users can identify:
- Trend Strength: Taller bars indicate a more aggressive push in the current direction.
- Momentum Shifts: When the bars switch from above the zero line to below it (or vice versa), it serves as a visual cue that the market's "energy" is changing, potentially marking the beginning of a reversal or a period of consolidation.
In summary, this tool acts as a momentum filter, stripping away minor price fluctuations to show you the underlying "pulse" of the market trend.
/*-----------------------------+
|			       |
| Shared by www.Aptrafx.com    |
|			       |
+------------------------------*/

//+------------------------------------------------------------------+
//|                                            T3_iAnchMom-hist.mq4  |
//|                                       Ramdass - Conversion only  |
//+------------------------------------------------------------------+


#property indicator_separate_window
#property indicator_buffers 2
#property indicator_color1 LightSeaGreen
#property indicator_color2 FireBrick

//---- input parameters
extern int EMA_period=3;
extern int MomPeriod=8;

extern int CountBars=300;
//---- buffers
double Up[];
double Down[];
double Mom;
double e1,e2,e3,e4,e5,e6,e7,e8,e9,e10,e11,e12;
double c1,c2,c3,c4;
double n,n1,w1,w2,b2,b3,w3,w4,b;
//+------------------------------------------------------------------+
//| Custom indicator initialization function                         |
//+------------------------------------------------------------------+
int init()
  {
//---- indicator line
   IndicatorBuffers(2);
   SetIndexStyle(0,DRAW_HISTOGRAM);
   SetIndexBuffer(0,Up);
   SetIndexStyle(1,DRAW_HISTOGRAM);
   SetIndexBuffer(1,Down);
//----
//----
//---- variable reset
/*e1=0; e2=0; e3=0; e4=0; e5=0; e6=0;
c1=0; c2=0; c3=0; c4=0;
n=0;n1=0;
w1=0; w2=0; w3=0; w4=0;
b2=0; b3=0;*/

b = 0.7;
b2=b*b;
b3=b2*b;
c1=-b3;
c2=(3*(b2+b3));
c3=-3*(2*b2+b+b3);
c4=(1+3*b+b3+3*b2);
n=EMA_period;
n1=MomPeriod + MomPeriod + 1;

if (n<1) n=1;
n = 1 + 0.5*(n-1);
w1 = 2 / (n + 1);
w2 = 1 - w1;
if (n1<1) n1=1;
n1 = 1 + 0.5*(n1-1);
w3 = 2 / (n1 + 1);
w4 = 1 - w3;
   return(0);
  }
//+------------------------------------------------------------------+
//| T3_iAnchMom                                                      |
//+------------------------------------------------------------------+
int start()
  {
   if (CountBars>Bars) CountBars=Bars;
   SetIndexDrawBegin(0,Bars-CountBars+(MomPeriod*2)*EMA_period);
   SetIndexDrawBegin(1,Bars-CountBars+(MomPeriod*2)*EMA_period);
   int i,counted_bars=IndicatorCounted();
   double a,c;

   if(Bars<=n1) return(0);

//---- initial zero
   if(counted_bars<n1)
   {
      for(i=1;i<=n1;i++) Up[CountBars-i]=0.0;
      for(i=1;i<=n1;i++) Down[CountBars-i]=0.0;
   }
//----
   i=CountBars-1;
//   if(counted_bars>=1) i=Bars-counted_bars-1;
   while(i>=0)
     {

e1 = w1*Close[i] + w2*e1;
e2 = w1*e1 + w2*e2;
e3 = w1*e2 + w2*e3;
e4 = w1*e3 + w2*e4;
e5 = w1*e4 + w2*e5;
e6 = w1*e5 + w2*e6;

a=c1*e6 + c2*e5 + c3*e4 + c4*e3;

e7 = w3*Close[i] + w4*e7;
e8 = w3*e7 + w4*e8;
e9 = w3*e8 + w4*e9;
e10 = w3*e9 + w4*e10;
e11 = w3*e10 + w4*e11;
e12 = w3*e11 + w4*e12;

c=c1*e12 + c2*e11 + c3*e10 + c4*e9;

      Mom = 100*((a / c)-1);
if (Mom>0) {Up[i]=Mom;Down[i]=0.0;} else {Down[i]=Mom;Up[i]=0.0;}

      i--;
     }
   return(0);
  }
//+------------------------------------------------------------------+
Comments