T3_TCF
Download script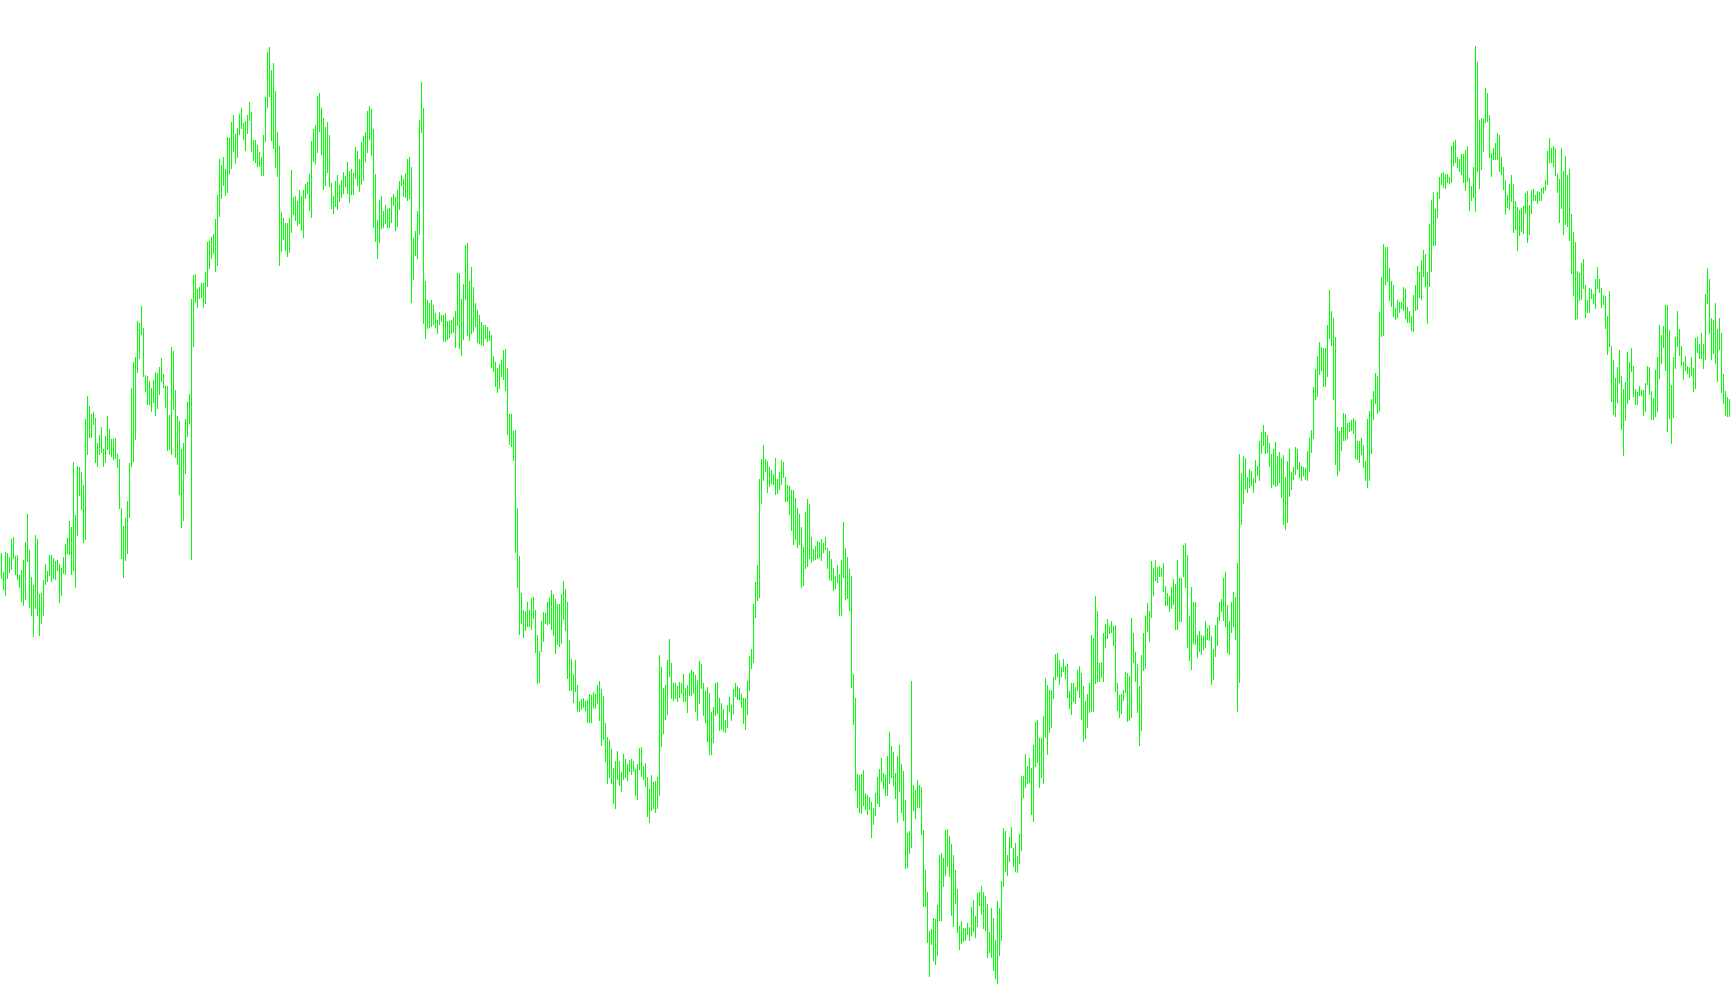
The T3 TrendCF is a sophisticated technical analysis tool designed to identify and visualize market trends with high precision. Unlike standard moving averages that can be sluggish or lag behind actual price movements, this script employs advanced mathematical smoothing to provide a clearer picture of the prevailing market direction.
Core Methodology
The logic behind this indicator is built on three primary pillars:
1. Multi-Stage Smoothing (Triple Exponential Logic) The script doesn't just look at the price; it processes the data through a multi-layered "smoothing" sequence. By passing the data through six successive stages of calculation, it effectively filters out "market noise"—those small, erratic price fluctuations that can often mislead traders. This ensures that the resulting trend line is fluid and representative of the broader market movement rather than momentary spikes.
2. The Continuation Factor (CF) A key unique feature of this script is the Continuation Factor. This is a customizable mathematical constant (defaulted to 0.618) used to weight the data. It influences how "aggressively" the indicator reacts to new price information. By balancing responsiveness with stability, it helps the indicator stay "locked" onto a trend while still acknowledging significant changes in momentum.
3. Differential Trend Analysis The script calculates two distinct sets of smoothed values (referred to internally as positive and negative components). By subtracting these two components from one another, the indicator isolates the net trend strength.
Visual Interpretation
- Trend Direction: The primary output provides a visual representation of the trend's path. When the values move in a consistent direction, it signals a strengthening trend.
- Trend Magnitude: The calculation helps distinguish between a weak, drifting market and a strong, directional move.
- Zero-Line Context: The indicator operates relative to a zero level; as the trend moves away from this baseline, it indicates the intensity of the current market momentum.
Summary for the User
In essence, the T3 TrendCF acts as a high-fidelity filter. It takes raw, volatile price data and subjects it to rigorous mathematical refinement to produce a smooth, continuous line. This allows traders to see the "true" direction of the market, making it easier to identify when a trend is firmly established or when it is losing its momentum.
//+------------------------------------------------------------------+
//|                                                   T3_TrendCF.mq4 |
//|                                         CF = Continuation Factor |
//|            Converted by and Copyright of: Ronald Verwer/ROVERCOM |
//|                                                         27/04/06 |
//+------------------------------------------------------------------+

#property indicator_separate_window
#property indicator_buffers 4
#property indicator_color1 Green
#property indicator_color2 Orange
#property indicator_color3 Silver
#property indicator_color4 Silver
#property indicator_width1 2
#property indicator_width2 2
#property indicator_width3 1
#property indicator_width4 1

extern int T3_Period = 16;
extern double T3_Continuation_Factor = 0.618;

double t1[];
double t2[];
double t3[];
double t4[];
double x1[];
double x2[];

double e1,e2,e3,e4,e5,e6;
double c1,c2,c3,c4;
double n,w1,w2,b1,b2,b3;

double ee1,ee2,ee3,ee4,ee5,ee6;

//+------------------------------------------------------------------+
//| Custom indicator initialization function |
//+------------------------------------------------------------------+
int init()
   {
//---- indicators setting

   IndicatorDigits(MarketInfo(Symbol(),MODE_DIGITS)+2);
   IndicatorShortName("T3 TrendCF "+T3_Period);

   IndicatorBuffers(6);
   SetIndexBuffer(0,t1);
   SetIndexBuffer(1,t2);
   SetIndexBuffer(2,t3);
   SetIndexBuffer(3,t4);
   SetIndexBuffer(4,x1);
   SetIndexBuffer(5,x2);
   SetIndexStyle(0,DRAW_LINE,STYLE_SOLID,2);
   SetIndexStyle(1,DRAW_LINE,STYLE_SOLID,2);
   SetIndexStyle(2,DRAW_HISTOGRAM,STYLE_SOLID,1);
   SetIndexStyle(3,DRAW_LINE,STYLE_SOLID,1);
   SetIndexLabel(0,"T3 pos: "+T3_Period);
   SetIndexLabel(1,"T3 neg: "+T3_Period);
   SetLevelStyle(0,1,Silver);
   SetLevelValue(0,0);

   //---- variable reset

   e1=0; e2=0; e3=0; e4=0; e5=0; e6=0;
   ee1=0; ee2=0; ee3=0; ee4=0; ee5=0; ee6=0;

   b1=T3_Continuation_Factor;
   b2=b1*b1;
   b3=b2*b1;
   c1=-b3;
   c2=(3*(b2+b3));
   c3=-3*(2*b2+b1+b3);
   c4=(1+3*b1+b3+3*b2);
   n=T3_Period;

   if (n<1) n=1;
   n = 1 + 0.5*(n-1);
   w1 = 2 / (n + 1);
   w2 = 1 - w1;

   //----
   return(0);
   }

//+------------------------------------------------------------------+
//| Custom indicator iteration function |
//+------------------------------------------------------------------+
int start()
   {
   int i,q,limit;
   double chp,chn,cffp,cffn;

   int counted_bars=IndicatorCounted();
//---- check for possible errors
   if(counted_bars<0) return(-1);
//---- last counted bar will be recounted
   if(counted_bars>0) counted_bars--;
   limit=Bars-counted_bars;

//---- indicator calculation
   for(i=limit; i>=0; i--)
      {
      x1[i]=iCustom(NULL,0,"Trend_CF",0,i);
      e1 = w1*x1[i] + w2*e1;
      e2 = w1*e1 + w2*e2;
      e3 = w1*e2 + w2*e3;
      e4 = w1*e3 + w2*e4;
      e5 = w1*e4 + w2*e5;
      e6 = w1*e5 + w2*e6;

      x2[i]=iCustom(NULL,0,"Trend_CF",1,i);
      ee1 = w1*x2[i] + w2*ee1;
      ee2 = w1*ee1 + w2*ee2;
      ee3 = w1*ee2 + w2*ee3;
      ee4 = w1*ee3 + w2*ee4;
      ee5 = w1*ee4 + w2*ee5;
      ee6 = w1*ee5 + w2*ee6;

      t1[i]=c1*e6 + c2*e5 + c3*e4 + c4*e3;
      t2[i]=c1*ee6 + c2*ee5 + c3*ee4 + c4*ee3;

      t3[i]=t1[i]-t2[i];
      t4[i]=t3[i];
      }
//----
   return(0);
   }
//+------------------------------------------------------------------+
Comments