T3_TRIX-histo
Download script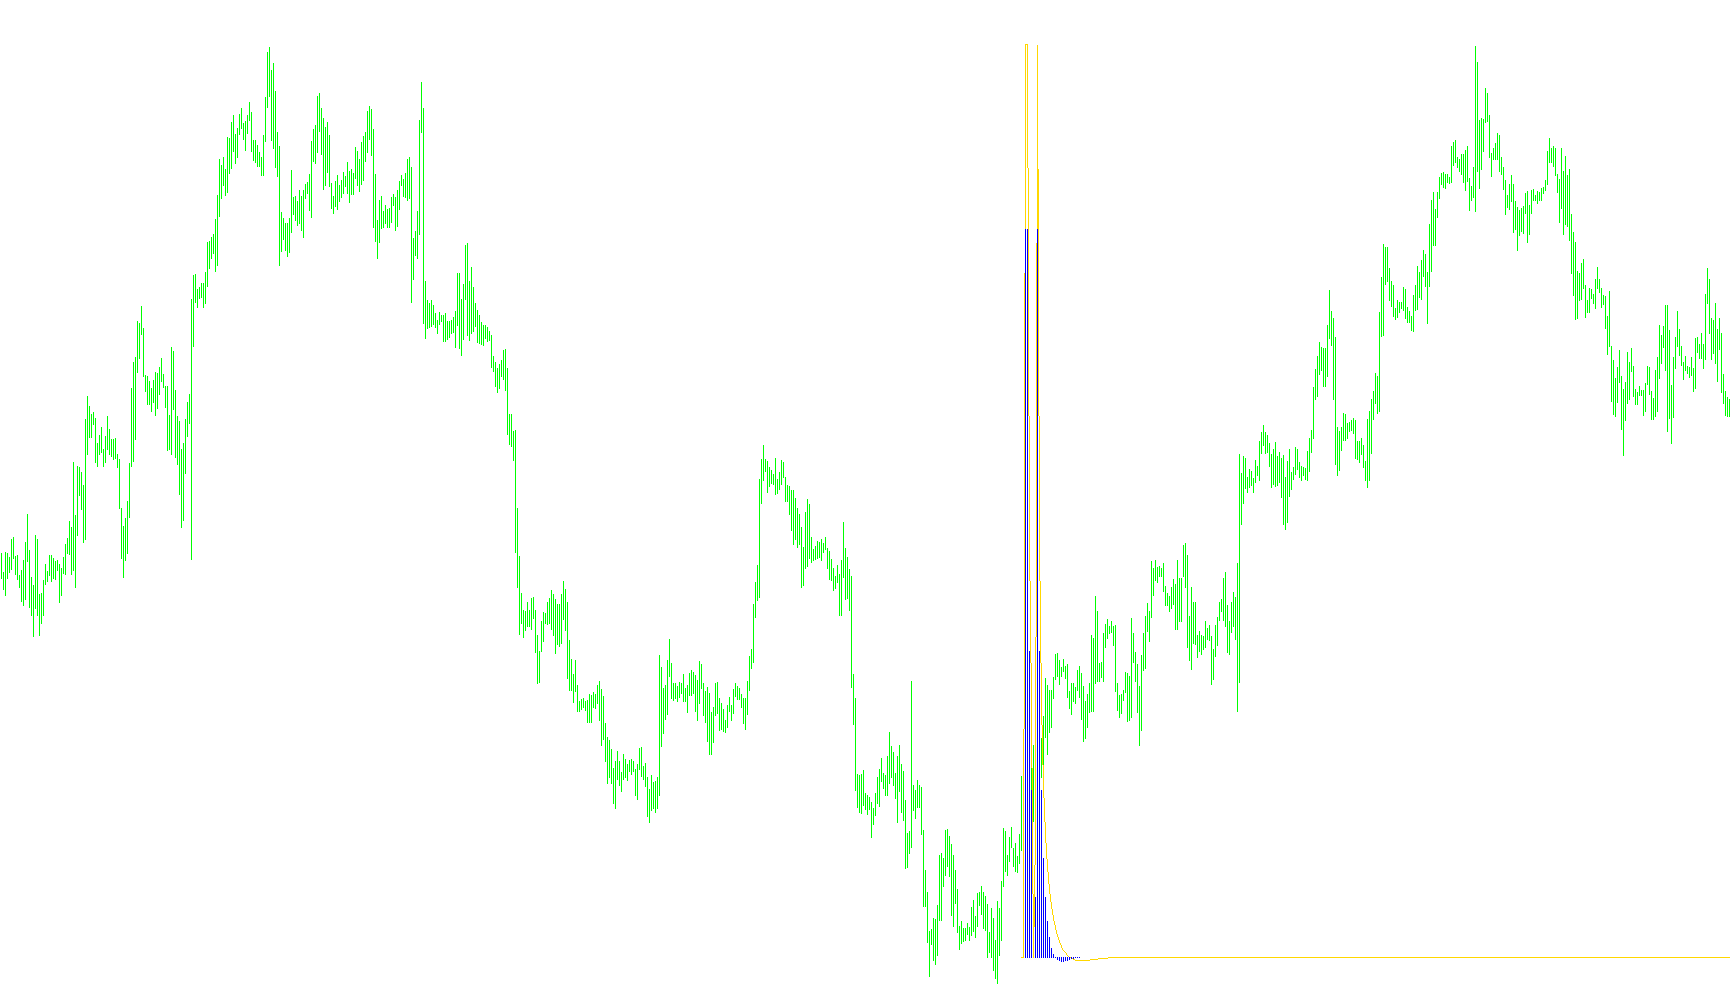
This script is a custom technical analysis indicator designed for the MetaTrader platform. It processes price data to generate two specific visual outputs—a line and a histogram—that help traders identify momentum trends by calculating the rate of change between different moving averages.
Core Logic Overview
The script functions by taking raw market prices (either the "Close" or "Open" prices, depending on user settings) and passing them through a series of complex mathematical filters. Instead of simply showing you a standard average price, it measures how fast those averages are moving or changing relative to one another.
How it Works
1. Multi-Layered Smoothing (T3 Logic) The indicator utilizes a sophisticated smoothing technique known as the T3 method. Rather than using a simple moving average, it applies multiple layers of calculations on the price data. This is designed to create a smoother curve that reduces "noise" (random price fluctuations) while maintaining a closer proximity to the actual price action than traditional smoothers often do.
2. Comparative Analysis The script calculates two distinct versions of this smoothed data simultaneously:
- Primary Component (A): Based on a primary time period (default is 18 bars).
- Secondary Component (B): Based on a secondary, shorter time period (default is 10 bars).
By calculating both, the script can compare short-term momentum against medium-term trends.
3. Rate of Change Calculation The final output shown on your chart is not the price itself, but the Rate of Change (ROC). The logic works as follows:
- It takes the current value of the smoothed average and compares it to its previous value.
- It calculates the percentage difference between these two points.
- The result tells the user how much the trend is accelerating or decelerating at any given moment.
4. Visual Outputs
- The Line (DeepSkyBlue): Represents the Rate of Change for the primary component. It shows the velocity of the main trend.
- The Histogram (Blue): Depending on your settings, this represents either the Rate of Change for the secondary component or a combined sum of both. This allows you to see how the faster price action interacts with the slower, steadier trend.
Summary for the User
Essentially, this tool helps you "see" the speed of the market. Instead of just knowing that the price is going up, it tells you if the upward move is gaining steam (accelerating) or losing energy (decelerating). It does this by comparing two different smoothed averages and highlighting the percentage difference in their movement over time.
//+------------------------------------------------------------------+
//|                                          T3 TRIX (ROC of T6).mq4 |
//|                      convert FinGeR Alex orginal by Luis Damiani |
//|                                                                  |
//+------------------------------------------------------------------+
#property copyright "convert FinGeR Alex orginal by Luis Damiani"
#property link      ""

#property indicator_separate_window
#property indicator_buffers 2
#property indicator_color1 DeepSkyBlue
#property indicator_color2 Blue
//---- input parameters
extern int       A_t3_period=18;
extern int       num_bars=350;
extern int       is_A_open_price=0;
extern int       B_t3_period_ac=10;
extern int       diferential=0;
extern double    hot=0.7;
//---- buffers
double ExtMapBuffer1[];
double ExtMapBuffer2[];
//+------------------------------------------------------------------+
//| Custom indicator initialization function                         |
//+------------------------------------------------------------------+
int init()
  {
//---- indicators
   SetIndexStyle(0,DRAW_LINE);
   SetIndexBuffer(0,ExtMapBuffer1);
   SetIndexStyle(1,DRAW_HISTOGRAM);
   SetIndexBuffer(1,ExtMapBuffer2);
//----
   return(0);
  }
//+------------------------------------------------------------------+
//| Custor indicator deinitialization function                       |
//+------------------------------------------------------------------+
int deinit()
  {
//----

//----
   return(0);
  }
//+------------------------------------------------------------------+
//| Custom indicator iteration function                              |
//+------------------------------------------------------------------+
int start()
  {

int  shift=0;
double A_t3=0,A_t3_1=0,max_per=0;
double  B_t3=0,B_t3_1=0;
double e1=0,e2=0,e3=0,e4=0,e5=0,e6=0,c1=0,c2=0,c3=0,c4=0;
double e1x=0,e2x=0,e3x=0,e4x=0,e5x=0,e6x=0;
double d1=0,d2=0,d3=0,d4=0,d5=0,d6=0;
double d1x=0,d2x=0,d3x=0,d4x=0,d5x=0,d6x=0;
double n=0,A_w1=0,A_w2=0,B_w1=0,B_w2=0,b2=0,b3=0;
double init=true;
double bar=0, prevbars=0, start=0, cs=0, prevcs=0,frame=0;
string commodt="nonono";
int    counted_bars=IndicatorCounted();

cs = num_bars+A_t3_period+is_A_open_price+B_t3_period_ac+diferential+hot;

if (cs==prevcs && commodt==Symbol() && frame==Time[4]-Time[5] && Bars-prevbars<2)
start=Bars-prevbars;
else start=-1;
commodt=Symbol();
frame=Time[4]-Time[5];
prevbars = Bars;
prevcs = cs;

if (start==1 || start==0)  bar=start; else init=true;

if (init==true)
{
  b2=hot*hot;
  b3=b2*hot;
  c1=-b3;
  c2=(3*(b2+b3));
  c3=-3*(2*b2+hot+b3);
  c4=(1+3*hot+b3+3*b2);

  n=A_t3_period;

  if (n<1) n=1;

  n = 1 + 0.5*(n-1);
  A_w1 = 2 / (n + 1);
  A_w2 = 1 - A_w1;

 n=B_t3_period_ac;

  if (n<1) n=1;
  n = 1 + 0.5*(n-1);
  B_w1 = 2 / (n + 1);
  B_w2 = 1 - B_w1;

ExtMapBuffer1[num_bars-1]=0;


e1x=0;e2x=0;e3x=0;e4x=0;e5x=0;e6x=0;

ExtMapBuffer2[num_bars-1]=0;

d1x=0;d2x=0;d3x=0;d4x=0;d5x=0;d6x=0;

// max_per=max(A_t3_period,B_t3_period_ac);
bar=num_bars-2;
init=false;
}


//SetLoopCount(0);
shift=bar;

while(shift>=0)

{

 if ( is_A_open_price==1 ) d1 = A_w1*Open[shift] + A_w2*d1x;
  else d1 = A_w1*Close[shift] + A_w2*d1x;
  d2 = A_w1*d1 + A_w2*d2x;
  d3 = A_w1*d2 + A_w2*d3x;
  d4 = A_w1*d3 + A_w2*d4x;
  d5 = A_w1*d4 + A_w2*d5x;
  d6 = A_w1*d5 + A_w2*d6x;

  A_t3 = c1*d6 + c2*d5 + c3*d4 + c4*d3;


if ((start==1 && shift==1) || start==-1  )
{

  d1x=d1;
  d2x=d2;
  d3x=d3;
  d4x=d4;
  d5x=d5;
  d6x=d6;
  }
  e1 = B_w1*Close[shift] + B_w2*e1x;
  e2 = B_w1*e1 + B_w2*e2x;
  e3 = B_w1*e2 + B_w2*e3x;
  e4 = B_w1*e3 + B_w2*e4x;
  e5 = B_w1*e4 + B_w2*e5x;
  e6 = B_w1*e5 + B_w2*e6x;
B_t3 = c1*e6 + c2*e5 + c3*e4 + c4*e3;

  if(diferential==1)
  {

   ExtMapBuffer1[shift]=(A_t3-A_t3_1)/A_t3_1;
   ExtMapBuffer2[shift]=(A_t3-A_t3_1)/A_t3_1+(B_t3-B_t3_1)/B_t3_1;


  }
  else
  {

if ( B_t3_1 >0 && A_t3_1>0) {
ExtMapBuffer2[shift]=(B_t3-B_t3_1)/B_t3_1;
ExtMapBuffer1[shift]=(A_t3-A_t3_1)/A_t3_1;
}
  //Comment("0");

  }

 //Comment("  start: ",start,"  bar: ",bar,"\n",
//"frame: ",frame,"  num_bars:" ,num_bars," commodity: ",commodt ,"\n",(B_t3-B_t3_1)/B_t3_1);

if ((start==1 && shift==1) || start==-1)
{
//Comment("Bar=ghfghfgh");
  A_t3_1=A_t3;
  B_t3_1=B_t3;
  e1x=e1;
  e2x=e2;
  e3x=e3;
  e4x=e4;
  e5x=e5;
  e6x=e6;

 }

  shift--;
//Comment("View !!!  NO?????");
   }
//----


  }
//+------------------------------------------------------------------+
Comments