T3_iAnchMom_hist
Download script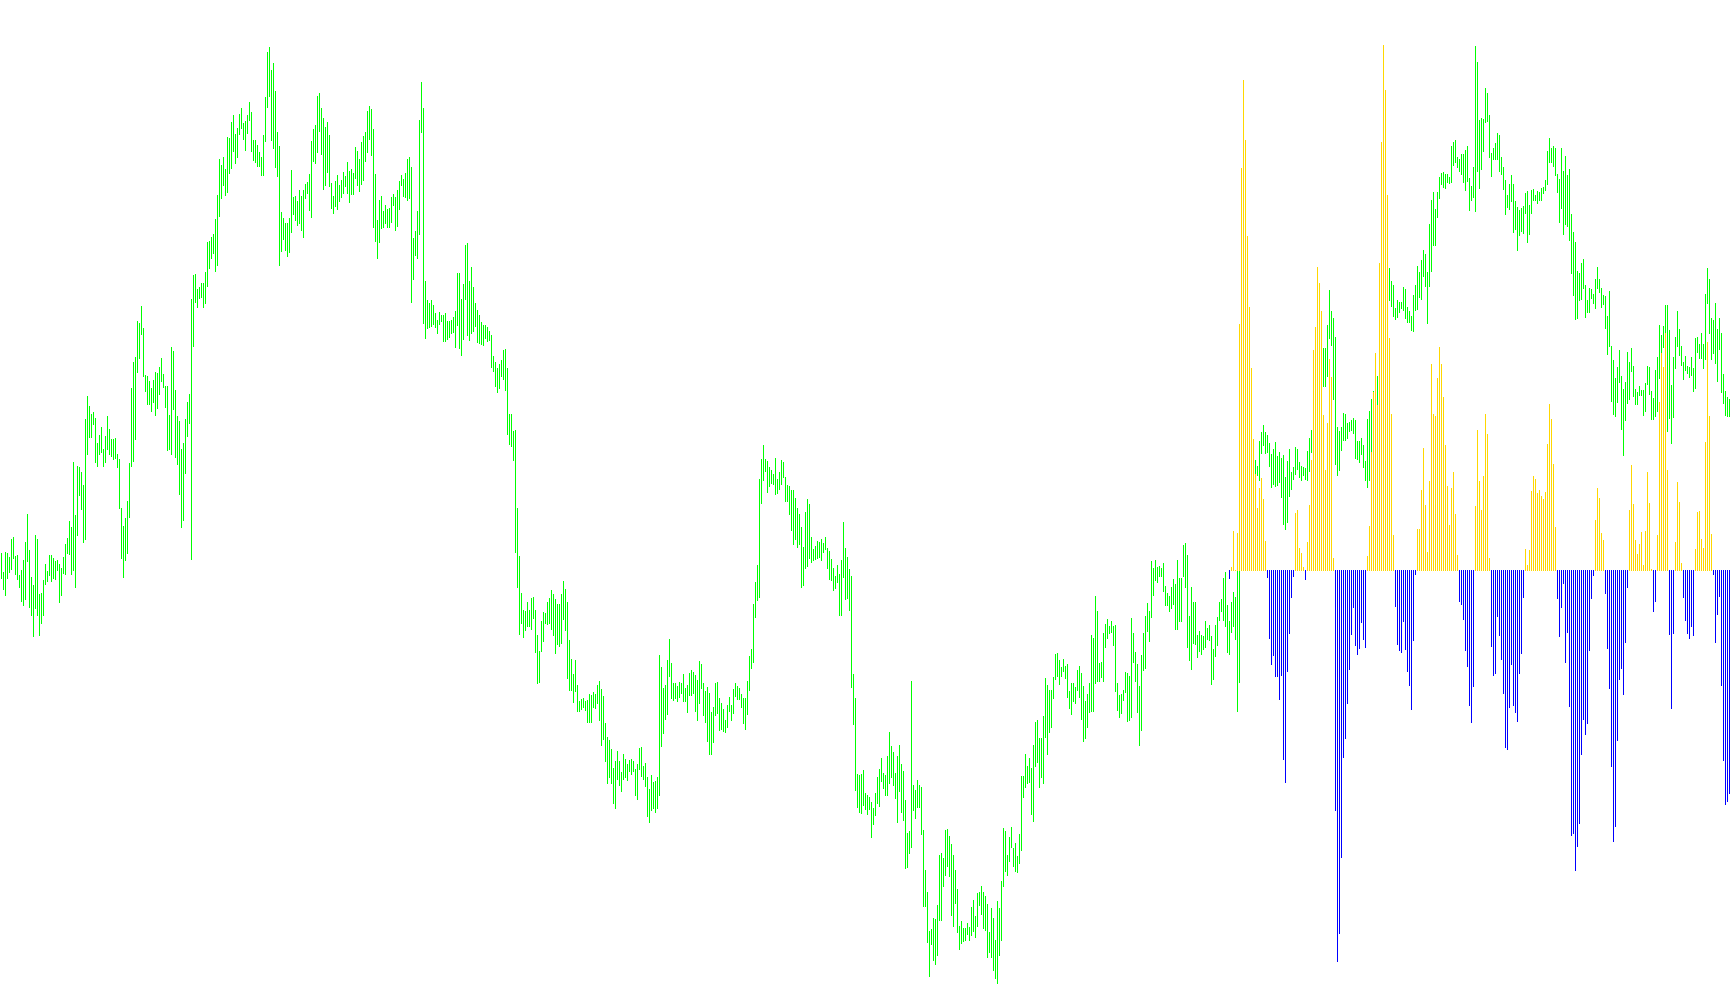
This tool is designed to provide a visual representation of market momentum by analyzing price trends through a multi-layered filtering process. Instead of simply looking at the immediate price change, it uses a sophisticated mathematical approach to smooth out "noise" and identify the underlying strength of a market move.
Core Logic Overview
The script operates by processing historical price data through two distinct stages of calculation:
1. Multi-Layered Smoothing (The "T3" Component) To prevent the indicator from reacting too aggressively to minor, insignificant price fluctuations, the logic employs a series of nested calculations based on Exponential Moving Averages (EMA). By passing the price through multiple layers, it creates a highly refined curve that follows the general trend. This ensures that the resulting momentum reflects a sustained movement rather than a momentary spike.
2. Momentum Comparison The tool calculates two different versions of these smoothed trends: one based on a short-term period and another based on a longer-term period. By comparing these two values against each other, the script determines the "Momentum."
- The Ratio: It calculates the relationship between the fast trend and the slow trend.
- Percentage Conversion: This relationship is then converted into a percentage to show how much "faster" or "slower" the current price action is moving relative to its historical average.
Visual Representation
The final output is displayed in a separate window as a histogram, which categorizes the market sentiment into two visual colors:
- Positive Momentum (Upward Trend): When the calculated momentum is positive, it indicates that the short-term trend is gaining strength relative to the long-term average. This is represented by a Light Sea Green histogram.
- Negative Momentum (Downward Trend): When the momentum falls below zero, it indicates that the price action is losing strength or trending downward compared to its history. This is represented by a Fire Brick histogram.
Summary for the User
In simple terms, this script acts as a "momentum speedometer." It ignores the distractions of small price wiggles and focuses on whether the current trend has enough underlying power to be considered significant. When you see the green bars, it suggests bullish momentum is dominant; when you see red bars, it suggests bearish momentum is taking hold.
//+------------------------------------------------------------------+
//|                                            T3_iAnchMom-hist.mq4  |
//|                                       Ramdass - Conversion only  |
//+------------------------------------------------------------------+


#property indicator_separate_window
#property indicator_buffers 2
#property indicator_color1 LightSeaGreen
#property indicator_color2 FireBrick

//---- input parameters
extern int EMA_period=3;
extern int MomPeriod=8;

extern int CountBars=300;
//---- buffers
double Up[];
double Down[];
double Mom;
double e1,e2,e3,e4,e5,e6,e7,e8,e9,e10,e11,e12;
double c1,c2,c3,c4;
double n,n1,w1,w2,b2,b3,w3,w4,b;
//+------------------------------------------------------------------+
//| Custom indicator initialization function                         |
//+------------------------------------------------------------------+
int init()
  {
//---- indicator line
   IndicatorBuffers(2);
   SetIndexStyle(0,DRAW_HISTOGRAM);
   SetIndexBuffer(0,Up);
   SetIndexStyle(1,DRAW_HISTOGRAM);
   SetIndexBuffer(1,Down);
//----
//----
//---- variable reset
/*e1=0; e2=0; e3=0; e4=0; e5=0; e6=0;
c1=0; c2=0; c3=0; c4=0;
n=0;n1=0;
w1=0; w2=0; w3=0; w4=0;
b2=0; b3=0;*/

b = 0.7;
b2=b*b;
b3=b2*b;
c1=-b3;
c2=(3*(b2+b3));
c3=-3*(2*b2+b+b3);
c4=(1+3*b+b3+3*b2);
n=EMA_period;
n1=MomPeriod + MomPeriod + 1;

if (n<1) n=1;
n = 1 + 0.5*(n-1);
w1 = 2 / (n + 1);
w2 = 1 - w1;
if (n1<1) n1=1;
n1 = 1 + 0.5*(n1-1);
w3 = 2 / (n1 + 1);
w4 = 1 - w3;
   return(0);
  }
//+------------------------------------------------------------------+
//| T3_iAnchMom                                                      |
//+------------------------------------------------------------------+
int start()
  {
   if (CountBars>Bars) CountBars=Bars;
   SetIndexDrawBegin(0,Bars-CountBars+(MomPeriod*2)*EMA_period);
   SetIndexDrawBegin(1,Bars-CountBars+(MomPeriod*2)*EMA_period);
   int i,counted_bars=IndicatorCounted();
   double a,c;

   if(Bars<=n1) return(0);

//---- initial zero
   if(counted_bars<n1)
   {
      for(i=1;i<=n1;i++) Up[CountBars-i]=0.0;
      for(i=1;i<=n1;i++) Down[CountBars-i]=0.0;
   }
//----
   i=CountBars-1;
//   if(counted_bars>=1) i=Bars-counted_bars-1;
   while(i>=0)
     {

e1 = w1*Close[i] + w2*e1;
e2 = w1*e1 + w2*e2;
e3 = w1*e2 + w2*e3;
e4 = w1*e3 + w2*e4;
e5 = w1*e4 + w2*e5;
e6 = w1*e5 + w2*e6;

a=c1*e6 + c2*e5 + c3*e4 + c4*e3;

e7 = w3*Close[i] + w4*e7;
e8 = w3*e7 + w4*e8;
e9 = w3*e8 + w4*e9;
e10 = w3*e9 + w4*e10;
e11 = w3*e10 + w4*e11;
e12 = w3*e11 + w4*e12;

c=c1*e12 + c2*e11 + c3*e10 + c4*e9;

      Mom = 100*((a / c)-1);
if (Mom>0) {Up[i]=Mom;Down[i]=0.0;} else {Down[i]=Mom;Up[i]=0.0;}

      i--;
     }
   return(0);
  }
//+------------------------------------------------------------------+
Comments