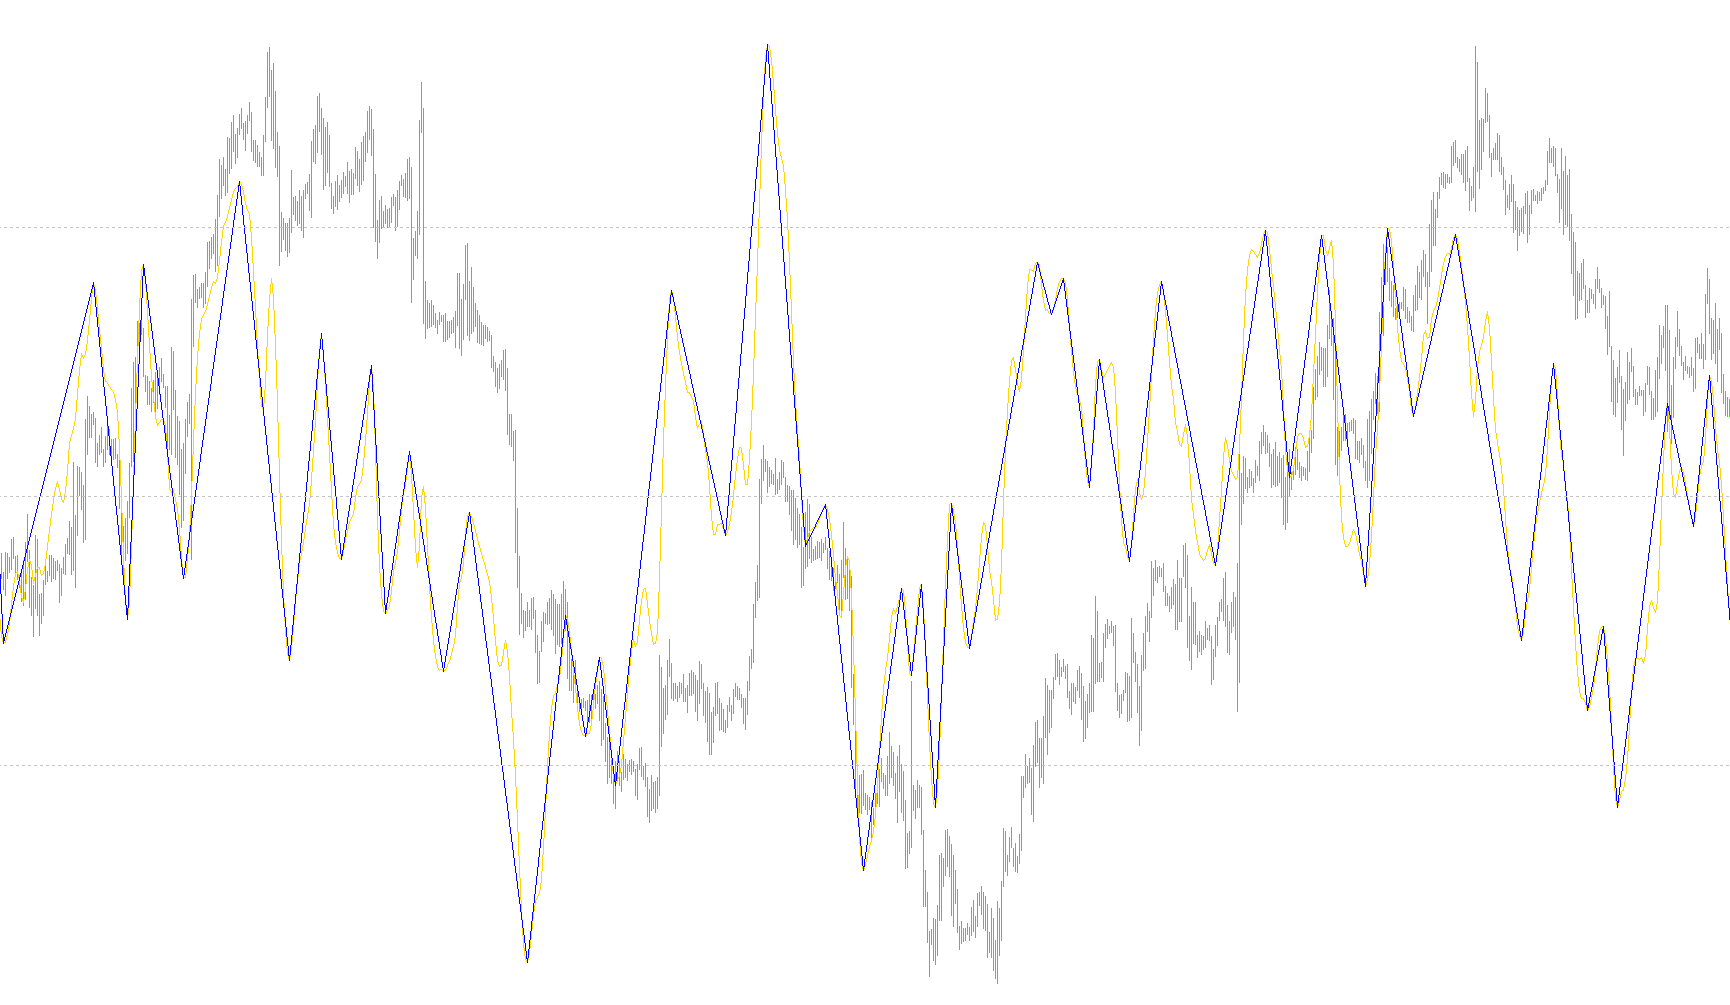
This script is a specialized technical analysis tool designed to track and smooth price momentum while identifying significant structural turning points in the market. It combines three distinct layers of mathematical logic to create a clean, readable visual for traders.
1. The Momentum Base (RSI)
The foundation of the tool is the Relative Strength Index (RSI). This standard metric measures the speed and change of price movements. By using this as a starting point, the script establishes a baseline for whether an asset is becoming overbought, oversold, or simply trending in a specific direction.
2. The Triple Smoothing Layer (T3)
To filter out the "noise" or small, erratic price fluctuations that often confuse traders, the script applies a sophisticated smoothing algorithm known as a T3 moving average to the RSI data. Unlike standard moving averages which can be sluggish or overly smooth, the T3 logic is designed to reduce lag while maintaining a very fluid curve. This ensures that the resulting line reacts quickly to meaningful trend changes without jumping erratically at every minor price tick.
3. The Structural Mapping (ZigZag Logic)
The final and most complex layer of the script involves a "ZigZag" style detection system. Instead of just showing a smooth curve, the logic performs the following tasks:
- Peak and Trough Detection: It scans the smoothed data to identify local highs and lows based on specific depth and deviation settings. This helps isolate the "bones" of the market structure.
- Validation Filtering: The script checks these peaks and troughs against a "backstep" rule. This prevents the tool from marking too many insignificant points in a row, ensuring that only substantial structural shifts are recorded.
- Conflict Resolution: If the logic detects multiple points simultaneously, it uses a priority system to decide which point is the most significant. It essentially "cleans up" the data by discarding overlapping or contradictory signals.
Summary of Visual Behavior
When looking at this indicator on a chart, the user sees a refined representation of price momentum. Rather than a messy web of data, the script provides a stabilized path that highlights the core trajectory of the market. It identifies where the trend has shifted significantly (turning points) while providing a smoothed line that allows traders to see the underlying strength of the current move more clearly than a standard RSI would allow.
//+------------------------------------------------------------------+
//|                                                t3_RSI_ZigZag.mq4 |
//|                                                                  |
//|                                                                  |
//+------------------------------------------------------------------+
#property copyright ""
#property link      ""

#property indicator_separate_window
//#property indicator_minimum 0
//#property indicator_maximum 100
#property indicator_buffers 2
#property indicator_color1 DodgerBlue
#property indicator_color2 Red
//---- input parameters
extern int RSIPeriod=14;
extern int t3_period=8;
extern double b=0.7;
extern int ExtDepth=12;
extern int ExtDeviation=5;
extern int ExtBackstep=3;
extern int LowLevel=30;
extern int MedLevel=50;
extern int HighLevel=70;
extern int Price=0; // 0 = Close
                    // 1 = Open
                    // 2 = High
                    // 3 = Low
                    // 4 = (H+L)/2
                    // 5 = (H+L+C)/3
                    // 6 = (H+L+C+C)/4
                    // other = Close
//---- buffers
double RSIBuffer[];
double t3_RSIBuffer[];
double ExtMapBuffer[];
double ExtLowBuffer[];
double ExtHighBuffer[];
double e1, e2, e3, e4, e5, e6, c1, c2, c3, c4, n, w1, w2, b2, b3;
//+------------------------------------------------------------------+
//| Custom indicator initialization function                         |
//+------------------------------------------------------------------+
int init()
  {
   string short_name;
//---- 2 additional buffers are used for counting.
   IndicatorBuffers(5);
   SetIndexBuffer(2,RSIBuffer);
   SetIndexBuffer(3,ExtLowBuffer);
   SetIndexBuffer(4,ExtHighBuffer);
//---- indicator line
   SetIndexStyle(0,DRAW_LINE);
   SetIndexBuffer(0,t3_RSIBuffer);
   SetIndexStyle(1,DRAW_SECTION);
   SetIndexBuffer(1,ExtMapBuffer);
   SetIndexEmptyValue(1,0.0);
//---- name for DataWindow and indicator subwindow label
   short_name="RSI("+RSIPeriod+")";
   IndicatorShortName(short_name);
   SetIndexLabel(0,short_name);
//----
   SetIndexDrawBegin(0,RSIPeriod+t3_period);
   SetIndexDrawBegin(1,RSIPeriod+t3_period);
   SetLevelValue(0,LowLevel);
   SetLevelValue(1,MedLevel);
   SetLevelValue(2,HighLevel);
   b2=b*b;
   b3=b2*b;
   c1=-b3;
   c2=(3*(b2+b3));
   c3=-3*(2*b2+b+b3);
   c4=(1+3*b+b3+3*b2);
   n=t3_period;

   if (n<1) n=1;
   n = 1 + 0.5*(n-1);
   w1 = 2 / (n + 1);
   w2 = 1 - w1;
//----
   return(0);
  }
//+------------------------------------------------------------------+
//| Relative Strength Index                                          |
//+------------------------------------------------------------------+
int start()
  {
   int    i,counted_bars=IndicatorCounted();
   double rel,negative,positive;
//----
   int    shift, back,lasthighpos,lastlowpos,index;
   double val,res;
   double curlow,curhigh,lasthigh,lastlow;
//----
   if(Bars<=RSIPeriod) return(0);
//---- initial zero
   if(counted_bars<1)
      for(i=1;i<=RSIPeriod;i++) RSIBuffer[Bars-i]=0.0;

   i=Bars-RSIPeriod-1;
   if(counted_bars>=RSIPeriod) i=Bars-counted_bars-1;
   if(Price<0 || Price>6) Price=0;
   for(; i>=0; i--)
    {
     RSIBuffer[i]=iRSI(NULL,0,RSIPeriod,Price,i);
    }
   for(i=Bars-1; i>=0; i--)
    {
     e1 = w1*RSIBuffer[i] + w2*e1;
     e2 = w1*e1 + w2*e2;
     e3 = w1*e2 + w2*e3;
     e4 = w1*e3 + w2*e4;
     e5 = w1*e4 + w2*e5;
     e6 = w1*e5 + w2*e6;

     t3_RSIBuffer[i] = c1*e6 + c2*e5 + c3*e4 + c4*e3;
    }
   for(shift=Bars-1; shift>=0; shift--)
     {
      int n, sn, r, result;
      bool ft=true;
      for(n=1; n<ExtDepth; n++)
       {
        sn=shift+n;
        if(ft)
         {
          if(t3_RSIBuffer[shift]<t3_RSIBuffer[sn]) result=shift;
          else result=sn;
          r=result;
          ft=false;
         }
        else
         {
          if(t3_RSIBuffer[r]<t3_RSIBuffer[sn]) result=r;
          else result=sn;
          r=result;
         }
       }
      index=r;
      val=t3_RSIBuffer[index];
      if(val==lastlow) val=0.0;
      else
        {
         lastlow=val;
         if((t3_RSIBuffer[shift]-val)>(ExtDeviation*Point)) val=0.0;
         else
           {
            for(back=1; back<=ExtBackstep; back++)
              {
               res=ExtLowBuffer[shift+back];
               if((res!=0)&&(res>val)) ExtLowBuffer[shift+back]=0.0;
              }
           }
        }
      ExtLowBuffer[shift]=0.0;
      if(val!=0.0) ExtLowBuffer[index]=val;
      //--- high
      ft=true;
      for(n=1; n<ExtDepth; n++)
       {
        sn=shift+n;
        if(ft)
         {
          if(t3_RSIBuffer[shift]>t3_RSIBuffer[sn]) result=shift;
          else result=sn;
          r=result;
          ft=false;
         }
        else
         {
          if(t3_RSIBuffer[r]>t3_RSIBuffer[sn]) result=r;
          else result=sn;
          r=result;
         }
       }
      index=r;
      val=t3_RSIBuffer[index];
      if(val==lasthigh) val=0.0;
      else
        {
         lasthigh=val;
         if((val-t3_RSIBuffer[shift])>(ExtDeviation*Point)) val=0.0;
         else
           {
            for(back=1; back<=ExtBackstep; back++)
              {
               res=ExtHighBuffer[shift+back];
               if((res!=0)&&(res<val)) ExtHighBuffer[shift+back]=0.0;
              }
           }
        }
      ExtHighBuffer[shift]=0.0;
      if(val!=0.0) ExtHighBuffer[index]=val;
     }
//---- final cutting
   lasthigh=-1; lasthighpos=-1;
   lastlow=-1;  lastlowpos=-1;

   for(shift=Bars-ExtDepth; shift>=0; shift--)
     {
      curlow=ExtLowBuffer[shift];
      curhigh=ExtHighBuffer[shift];
      if(curlow==0 && curhigh==0) continue;
      //---
      if(curhigh!=0)
        {
         if(lasthigh>0)
           {
            if(lasthigh<curhigh) ExtHighBuffer[lasthighpos]=0;
            else ExtHighBuffer[shift]=0;
           }
         //---
         if(lasthigh<curhigh || lasthigh<0)
           {
            lasthigh=curhigh;
            lasthighpos=shift;
           }
         lastlow=-1;
        }
      //----
      if(curlow!=0)
        {
         if(lastlow>0)
           {
            if(lastlow>curlow) ExtLowBuffer[lastlowpos]=0;
            else ExtLowBuffer[shift]=0;
           }
         //---
         if((curlow<lastlow)||(lastlow<0))
           {
            lastlow=curlow;
            lastlowpos=shift;
           }
         lasthigh=-1;
        }
     }
//---- merge 2 buffers
   lasthighpos=-1;
   lastlowpos=-1;
   for(shift=Bars-1; shift>=0; shift--)
     {
      if(shift>=Bars-ExtDepth) ExtMapBuffer[shift]=0.0;
      else
        {
         curlow=ExtLowBuffer[shift];
         curhigh=ExtHighBuffer[shift];
         //----
         res=0;
         if(curlow!=0)
           {
            if(lastlowpos==-1)
              {
               res=curlow;
               lastlowpos=shift;
              }
            else
              {
               if(lasthighpos!=-1 && lastlowpos>lasthighpos)
                 {
                  res=curlow;
                  lastlowpos=shift;
                 }
              }
           }
         if(curhigh!=0)
           {
            if(lasthighpos==-1)
              {
               res=curhigh;
               lasthighpos=shift;
              }
            else
              {
               if(lastlowpos!=-1 && lasthighpos>lastlowpos)
                 {
                  res=curhigh;
                  lasthighpos=shift;
                 }
              }
           }
         //----
         ExtMapBuffer[shift]=res;
        }
     }

//----
   return(0);
  }
//+------------------------------------------------------------------+
Comments