Taf_v2
Download script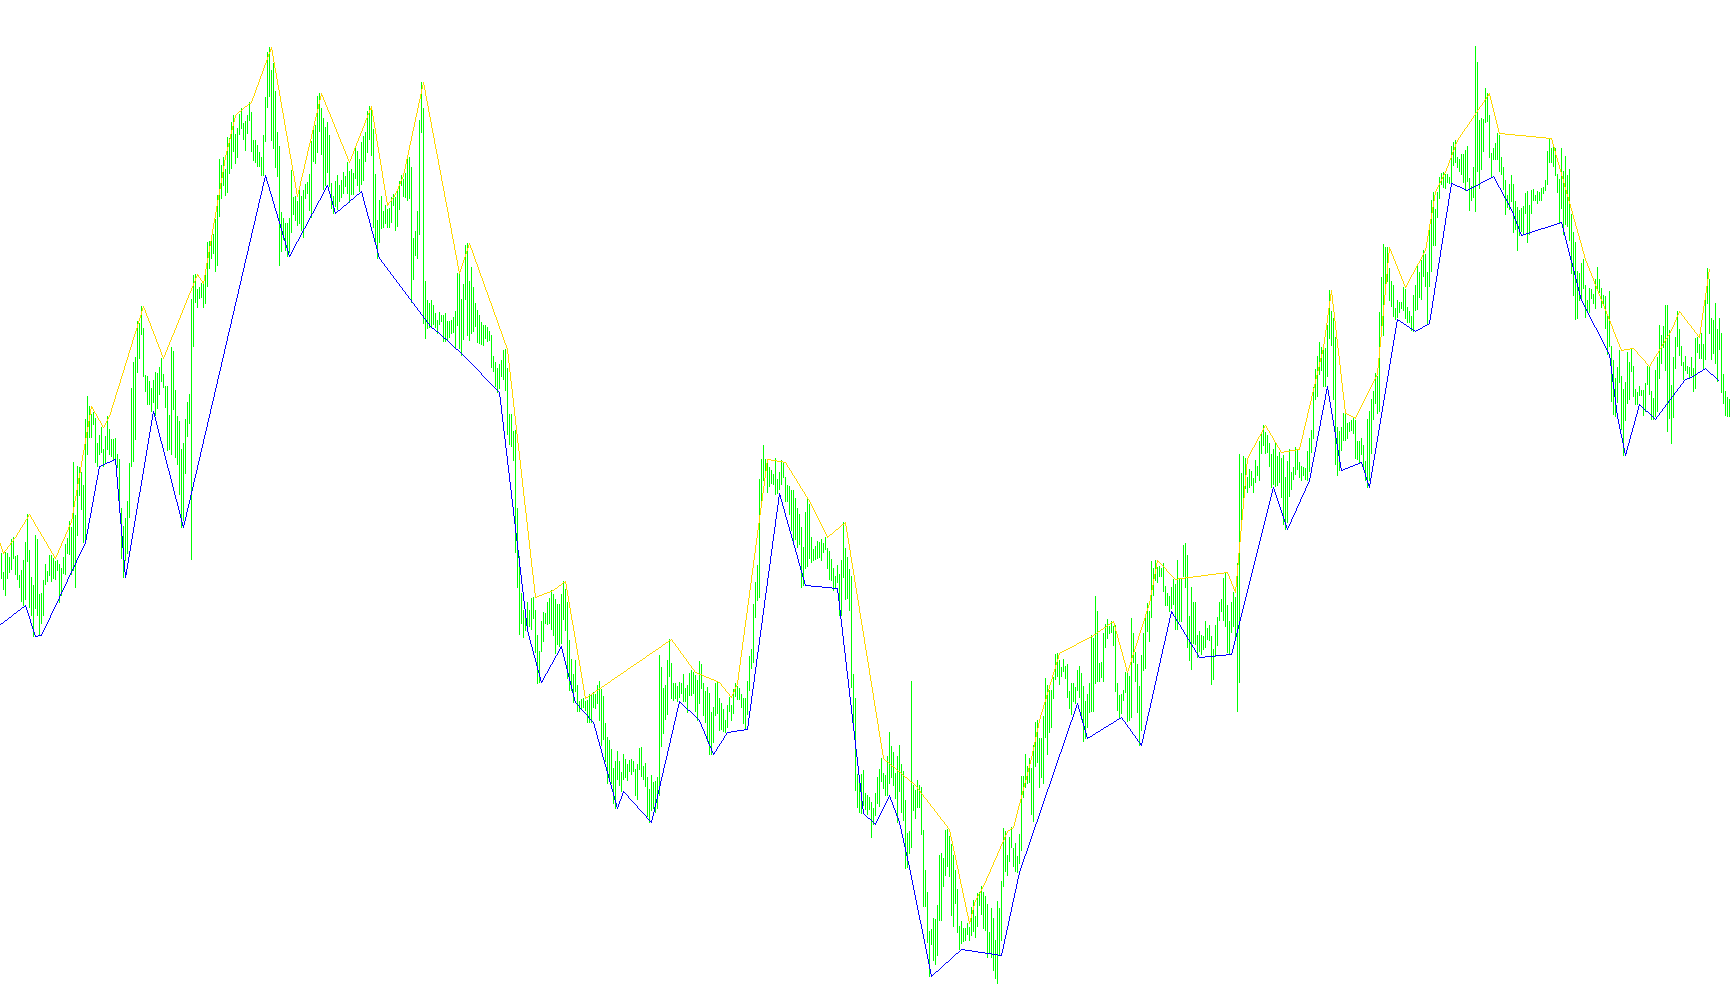
This script functions as a visual market analysis tool designed to identify specific trends and structural shifts in price movement. Rather than showing every minor fluctuation, it focuses on identifying sustained momentum by tracking whether the market is consistently moving upward or downward over a series of consecutive bars.
Core Logic and Behavior
The tool works by monitoring the relationship between the high and low prices of current candles compared to the previous ones. It categorizes price movement into two distinct types:
- Upward Momentum Tracking: The script looks for instances where both the high and the low of a new candle are higher than the previous candle. When this happens, it increments an internal counter. Once this upward movement persists for a specific number of consecutive bars (defined by the user settings), the script identifies a significant trend point and marks it on your chart with a blue section.
- Downward Momentum Tracking: Conversely, the script monitors for instances where both the high and low of a new candle are lower than the previous candle. It keeps a separate count for these downward movements. When the price drops consistently for the required number of consecutive bars, it marks that point on your chart with a red section.
Visual Representation
The indicator produces two distinct visual lines on your trading platform:
- The High Buffer (Red): This highlights areas where the market has shown sustained downward pressure.
- The Low Buffer (Blue): This highlights areas where the market has shown sustained upward momentum.
Key Features for the Trader
- Trend Filtering: By requiring a specific number of consecutive movements before triggering a visual mark, the script helps filter out "market noise"—the small, insignificant price fluctuations that can often lead to false signals.
- Customizable Sensitivity: The logic includes a configurable parameter that allows you to decide how many consecutive moves are required to confirm a trend. A higher number makes the indicator more conservative (identifying stronger, longer trends), while a lower number makes it more sensitive to rapid price changes.
- Dynamic Analysis: The script automatically processes historical data and updates in real-time, ensuring that the visual indicators move along with the live price action.
Miscellaneous
8
Views
0
Downloads
0
Favorites
Taf_v2
//+------------------------------------------------------------------+
//|                                                          Taf.mq4 |
//|                               Copyright © 2004, Poul_Trade_Forum |
//|                                                         Aborigen |
//|                                          http://forex.kbpauk.ru/ |
//+------------------------------------------------------------------+
#property copyright "Poul Trade Forum"
#property link      "http://forex.kbpauk.ru/"
#property indicator_chart_window
#property indicator_buffers 2
#property indicator_color1 Blue
#property indicator_color2 Red
//---- input parameters
extern int BQUALIFY = 2;
//---- buffers
double HighBuffer[];
double LowBuffer[];
//----
double VALUE1, VALUE2, VALUE3, VALUE4, VALUE5, VALUE6;
//+------------------------------------------------------------------+
//| Custom indicator initialization function                         |
//+------------------------------------------------------------------+
int init()
  {
//---- indicator line
   SetIndexStyle(0, DRAW_SECTION);
   SetIndexStyle(1, DRAW_SECTION);
//----
   SetIndexBuffer(0, HighBuffer);
   SetIndexBuffer(1, LowBuffer);
//----
   SetIndexEmptyValue(0, 0);
   SetIndexEmptyValue(1, 0);
//---- name for DataWindow and indicator subwindow label
   IndicatorShortName("Taf(" + BQUALIFY + ")");
   SetIndexLabel(0, "TafHigh(" + BQUALIFY + ")");
   SetIndexLabel(1, "TafLow(" + BQUALIFY + ")");
//----
   SetIndexDrawBegin(0,100);
   SetIndexDrawBegin(1,100);
//----
   return(0);
  }
//+------------------------------------------------------------------+
//| Custor indicator deinitialization function                       |
//+------------------------------------------------------------------+
int deinit()
  {
//----
   return(0);
  }
//+------------------------------------------------------------------+
//| Custom indicator iteration function                              |
//+------------------------------------------------------------------+
int start()
  {
   int counted_bars = IndicatorCounted(), i, shift;
   i = (Bars - counted_bars) - 1;
//----
   for(shift = i; shift >= 0; shift--)
     {
       LowBuffer[shift] = 0;
       HighBuffer[shift] = 0;
       if(High[shift] >= High[shift+1] && Low[shift] >= Low[shift+1])
          {
            if(VALUE2 >= BQUALIFY)
                LowBuffer[shift] = Low[shift+1];
            if(VALUE2 > 0)
                VALUE5 = Low[shift+1];
            VALUE1 = VALUE1+1;
            VALUE3 = VALUE1;
            VALUE2 = 0;
          }
       //----
       if(Low[shift]<=Low[shift+1] && High[shift]<=High[shift+1])
         {
           if(VALUE1 >= BQUALIFY)
               HighBuffer[shift] = High[shift+1];
           if(VALUE1 > 0)
               VALUE6 = High[shift+1];
           VALUE2 = VALUE2 + 1;
           VALUE4 = VALUE2;
           VALUE1 = 0;
         }
     }
   return(0);
  }
//+------------------------------------------------------------------+
Comments