StepSto_v1
Download script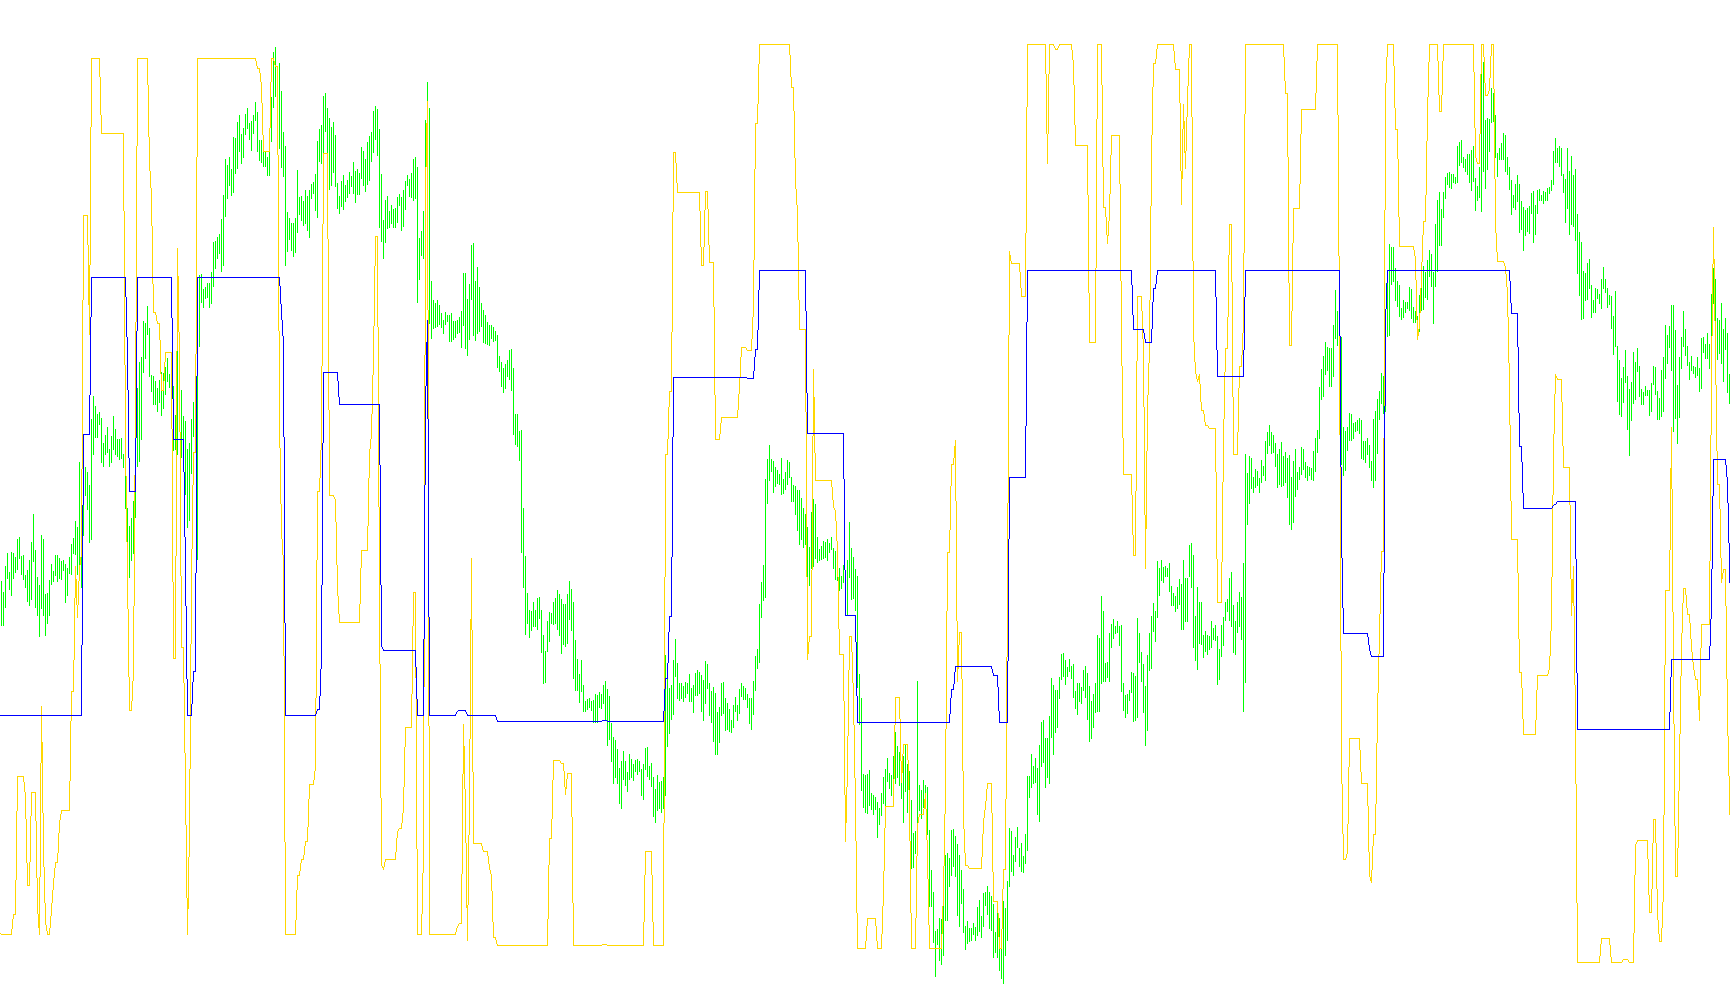
The StepSto indicator is a specialized technical analysis tool designed to help traders visualize market trends and momentum by measuring how far the current price moves relative to dynamic "steps" or boundaries. Unlike standard indicators that simply follow the price, this script attempts to identify the strength of a trend based on volatility.
Core Logic and Mechanism
The indicator operates through three primary stages:
1. Volatility Measurement (ATR Calculation) The tool begins by analyzing the Average True Range (ATR) over a set period. The ATR represents the "noise" or average movement of the market. By calculating the minimum, maximum, and average volatility during this period, the script establishes the scale for its "steps." This ensures that the indicator adapts to different market conditions—expanding during high volatility and contracting during quieter periods.
2. Dynamic Step Boundaries Instead of using fixed price levels, the script creates three sets of dynamic boundaries (Minimum, Maximum, and Mid-point) based on the calculated volatility:
- Minimum: Based on the smallest recent price movements.
- Maximum: Based on the largest recent price movements.
- Mid-point: A balanced average of the two.
For each of these three sets, the script identifies the current "Trend Direction." It looks at whether the price has broken above the upper boundary or below the lower boundary. If a trend is established (upward or downward), the indicator "locks" onto that movement, tracking the lowest or highest point reached within that specific trend until a reversal occurs.
3. Momentum Mapping (The Stochastic Conversion) The final step involves converting these price boundaries into a normalized visual format. The script takes the current position of the price relative to these dynamic "steps" and maps it onto a scale of 0 to 100.
This produces two distinct lines:
- Fast Line: Derived from the "Minimum" volatility steps, which reacts more quickly to immediate price changes.
- Slow Line: Derived from the "Mid-point" volatility steps, which provides a smoother, more moderated view of the market trend.
How to Interpret the Visuals
The resulting output is a two-line oscillator displayed in a separate window (ranging from 0 to 100). By observing where these lines sit relative to the 30 and 70 levels:
- Trend Strength: When both lines are high, it suggests a strong upward trend. When both are low, it suggests a strong downward trend.
- Momentum Shifts: The distance between the Fast and Slow lines can indicate how quickly the current move is accelerating or exhausting.
- Volatility Adaptation: Because the "steps" are based on ATR, the indicator remains relevant whether the market is moving in small increments or large swings, automatically adjusting its sensitivity to match the current environment.
//+------------------------------------------------------------------+
//|                                                   StepSto_v1.mq4 |
//|                           Copyright © 2005, TrendLaboratory Ltd. |
//|            http://finance.groups.yahoo.com/group/TrendLaboratory |
//|                                       E-mail: igorad2004@list.ru |
//+------------------------------------------------------------------+
#property copyright "Copyright © 2005, TrendLaboratory Ltd."
#property link      "http://finance.groups.yahoo.com/group/TrendLaboratory"

#property indicator_separate_window
#property indicator_minimum 0
#property indicator_maximum 100
#property indicator_level1 30
#property indicator_level2 70
#property indicator_buffers 2
#property indicator_color1 Yellow
#property indicator_color2 DeepSkyBlue
//---- input parameters
extern double Kfast=1.0000;
extern double Kslow=1.0000;
//---- indicator buffers
double LineFastBuffer[];
double LineSlowBuffer[];
//+------------------------------------------------------------------+
//| Custom indicator initialization function                         |
//+------------------------------------------------------------------+
  int init()
  {
   string short_name;
//---- indicator line
   SetIndexStyle(0,DRAW_LINE,STYLE_SOLID,1);
   SetIndexStyle(1,DRAW_LINE,STYLE_SOLID,1);
   SetIndexBuffer(0,LineFastBuffer);
   SetIndexBuffer(1,LineSlowBuffer);
   IndicatorDigits(MarketInfo(Symbol(),MODE_DIGITS));
//---- name for DataWindow and indicator subwindow label
   short_name="StepSto("+Kfast+","+Kslow+")";
   IndicatorShortName(short_name);
   SetIndexLabel(0,"StepSto Fast");
   SetIndexLabel(1,"StepSto Slow");
//----
   SetIndexDrawBegin(0,10);
   SetIndexDrawBegin(1,10);
//----
   return(0);
  }

//+------------------------------------------------------------------+
//| StepSto_v1                                                       |
//+------------------------------------------------------------------+
int start()
  {
   int      shift,TrendMin,TrendMax,TrendMid;
   double   SminMin0,SmaxMin0,SminMin1,SmaxMin1,ATR0,ATRmax,ATRmin;
   double   SminMax0,SmaxMax0,SminMax1,SmaxMax1,SminMid0,SmaxMid0,SminMid1,SmaxMid1;
   double   linemin,linemax,linemid,Sto1,Sto2,bsmin,bsmax;

   double   PeriodATR=10;
   for(shift=Bars-1-PeriodATR;shift>=0;shift--)
   {
	ATR0 = iATR(NULL,0,PeriodATR,shift);

	ATRmax=MathMax(ATR0,ATRmax);
	if (shift==Bars-1-PeriodATR) ATRmin=ATR0;
	ATRmin=MathMin(ATR0,ATRmin);

	double StepSizeMin=(Kfast*ATRmin);
	double StepSizeMax=(Kfast*ATRmax);
	double StepSizeMid=(Kfast*0.5*Kslow*(ATRmax+ATRmin));

	  SmaxMin0=Close[shift]+2*StepSizeMin;
	  SminMin0=Close[shift]-2*StepSizeMin;

	  SmaxMax0=Close[shift]+2*StepSizeMax;
	  SminMax0=Close[shift]-2*StepSizeMax;

	  SmaxMid0=Close[shift]+2*StepSizeMid;
	  SminMid0=Close[shift]-2*StepSizeMid;

	  if(Close[shift]>SmaxMin1) TrendMin=1;
	  if(Close[shift]<SminMin1) TrendMin=-1;

	  if(Close[shift]>SmaxMax1) TrendMax=1;
	  if(Close[shift]<SminMax1) TrendMax=-1;

	  if(Close[shift]>SmaxMid1) TrendMid=1;
	  if(Close[shift]<SminMid1) TrendMid=-1;

	  if(TrendMin>0 && SminMin0<SminMin1) SminMin0=SminMin1;
	  if(TrendMin<0 && SmaxMin0>SmaxMin1) SmaxMin0=SmaxMin1;

	  if(TrendMax>0 && SminMax0<SminMax1) SminMax0=SminMax1;
	  if(TrendMax<0 && SmaxMax0>SmaxMax1) SmaxMax0=SmaxMax1;

	  if(TrendMid>0 && SminMid0<SminMid1) SminMid0=SminMid1;
	  if(TrendMid<0 && SmaxMid0>SmaxMid1) SmaxMid0=SmaxMid1;


	  if (TrendMin>0) linemin=SminMin0+StepSizeMin;
	  if (TrendMin<0) linemin=SmaxMin0-StepSizeMin;

	  if (TrendMax>0) linemax=SminMax0+StepSizeMax;
	  if (TrendMax<0) linemax=SmaxMax0-StepSizeMax;

	  if (TrendMid>0) linemid=SminMid0+StepSizeMid;
	  if (TrendMid<0) linemid=SmaxMid0-StepSizeMid;

	  bsmin=linemax-StepSizeMax;
	  bsmax=linemax+StepSizeMax;

	  Sto1=(linemin-bsmin)/(bsmax-bsmin);
	  Sto2=(linemid-bsmin)/(bsmax-bsmin);

	  LineFastBuffer[shift]=Sto1*100;
	  LineSlowBuffer[shift]=Sto2*100;

	  SminMin1=SminMin0;
	  SmaxMin1=SmaxMin0;

	  SminMax1=SminMax0;
	  SmaxMax1=SmaxMax0;

	  SminMid1=SminMid0;
	  SmaxMid1=SmaxMid0;
	 }
	return(0);
 }
Comments