StepSto_v1_v2
Download script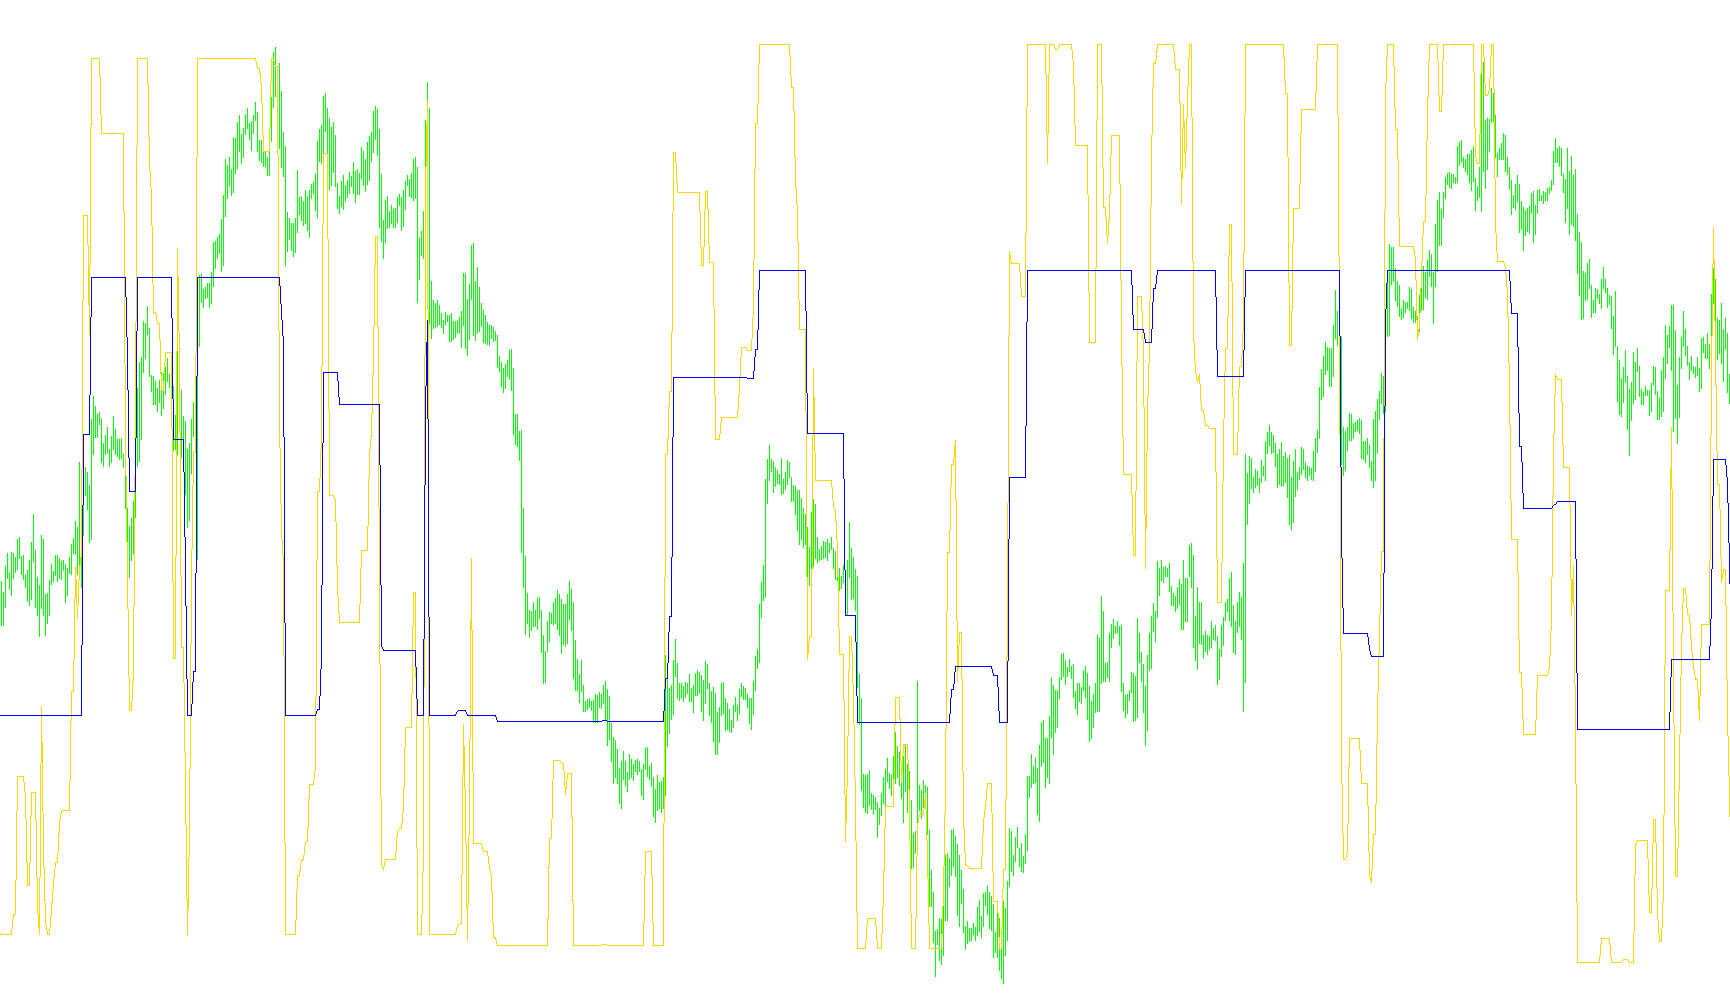
The StepSto indicator is a specialized technical analysis tool designed to help traders identify price trends and momentum by calculating "steps" or zones of movement. Unlike standard oscillators that might fluctuate wildly, this logic focuses on defining the boundaries of price action to determine whether the current trend is accelerating, steady, or reversing.
How the Logic Works
The core functionality of the script relies on three main pillars:
1. Volatility Measurement The indicator begins by analyzing the recent market volatility using an Average True Range (ATR) calculation. By looking at how much the price typically moves over a set period, it establishes a "ruler" to measure current price movements. This ensures that the indicator scales correctly regardless of whether you are trading a highly volatile currency pair or a more stable one.
2. Trend Boundary Detection The script calculates three distinct types of trend boundaries based on different sensitivities:
- Minimum: A tight boundary for quick reactions to small price moves.
- Maximum: A wide boundary for identifying long-term, significant market shifts.
- Mid: A balanced middle ground intended to capture the "average" trend.
For each of these categories, the logic constantly checks where the current price sits in relation to these boundaries. If the price breaks above a maximum boundary, the indicator recognizes a strong upward trend; if it drops below a minimum boundary, it registers a downward shift.
3. Dynamic Level Normalization (The "Sto" Calculation) Once the direction and strength of the trend are identified, the script performs a normalization process. It takes the price positions within those calculated boundaries and converts them into a percentage-based scale (ranging from 0 to 100).
This is why the indicator appears in a separate window at the bottom of your chart:
- The Fast Line: Provides a quick response to the most immediate price movements.
- The Slow Line: Smooths out the "noise" to show the broader momentum.
Summary for the Trader
Instead of simply telling you where the price is, this script tells you where the price sits relative to its current momentum. When both lines move toward the top of the window (100), it suggests strong bullish pressure. When they drop toward the bottom (0), it indicates bearish pressure. By using different "steps" (Min, Mid, and Max), the logic helps traders distinguish between minor price fluctuations and legitimate trend changes.
/*-----------------------------+
|			       |
| Shared by www.Aptrafx.com    |
|			       |
+------------------------------*/

//+------------------------------------------------------------------+
//|                                                   StepSto_v1.mq4 |
//|                           Copyright © 2005, TrendLaboratory Ltd. |
//|            http://finance.groups.yahoo.com/group/TrendLaboratory |
//|                                       E-mail: igorad2004@list.ru |
//+------------------------------------------------------------------+
#property copyright "Copyright © 2005, TrendLaboratory Ltd."
#property link      "http://finance.groups.yahoo.com/group/TrendLaboratory"

#property indicator_separate_window
#property indicator_minimum 0
#property indicator_maximum 100
#property indicator_level1 30
#property indicator_level2 70
#property indicator_buffers 2
#property indicator_color1 Yellow
#property indicator_color2 DeepSkyBlue
//---- input parameters
extern double Kfast=1.0000;
extern double Kslow=1.0000;
//---- indicator buffers
double LineFastBuffer[];
double LineSlowBuffer[];
//+------------------------------------------------------------------+
//| Custom indicator initialization function                         |
//+------------------------------------------------------------------+
  int init()
  {
   string short_name;
//---- indicator line
   SetIndexStyle(0,DRAW_LINE,STYLE_SOLID,1);
   SetIndexStyle(1,DRAW_LINE,STYLE_SOLID,1);
   SetIndexBuffer(0,LineFastBuffer);
   SetIndexBuffer(1,LineSlowBuffer);
   IndicatorDigits(MarketInfo(Symbol(),MODE_DIGITS));
//---- name for DataWindow and indicator subwindow label
   short_name="StepSto("+Kfast+","+Kslow+")";
   IndicatorShortName(short_name);
   SetIndexLabel(0,"StepSto Fast");
   SetIndexLabel(1,"StepSto Slow");
//----
   SetIndexDrawBegin(0,10);
   SetIndexDrawBegin(1,10);
//----
   return(0);
  }

//+------------------------------------------------------------------+
//| StepSto_v1                                                       |
//+------------------------------------------------------------------+
int start()
  {
   int      shift,TrendMin,TrendMax,TrendMid;
   double   SminMin0,SmaxMin0,SminMin1,SmaxMin1,ATR0,ATRmax,ATRmin;
   double   SminMax0,SmaxMax0,SminMax1,SmaxMax1,SminMid0,SmaxMid0,SminMid1,SmaxMid1;
   double   linemin,linemax,linemid,Sto1,Sto2,bsmin,bsmax;

   double   PeriodATR=10;
   for(shift=Bars-1-PeriodATR;shift>=0;shift--)
   {
	ATR0 = iATR(NULL,0,PeriodATR,shift);

	ATRmax=MathMax(ATR0,ATRmax);
	if (shift==Bars-1-PeriodATR) ATRmin=ATR0;
	ATRmin=MathMin(ATR0,ATRmin);

	double StepSizeMin=(Kfast*ATRmin);
	double StepSizeMax=(Kfast*ATRmax);
	double StepSizeMid=(Kfast*0.5*Kslow*(ATRmax+ATRmin));

	  SmaxMin0=Close[shift]+2*StepSizeMin;
	  SminMin0=Close[shift]-2*StepSizeMin;

	  SmaxMax0=Close[shift]+2*StepSizeMax;
	  SminMax0=Close[shift]-2*StepSizeMax;

	  SmaxMid0=Close[shift]+2*StepSizeMid;
	  SminMid0=Close[shift]-2*StepSizeMid;

	  if(Close[shift]>SmaxMin1) TrendMin=1;
	  if(Close[shift]<SminMin1) TrendMin=-1;

	  if(Close[shift]>SmaxMax1) TrendMax=1;
	  if(Close[shift]<SminMax1) TrendMax=-1;

	  if(Close[shift]>SmaxMid1) TrendMid=1;
	  if(Close[shift]<SminMid1) TrendMid=-1;

	  if(TrendMin>0 && SminMin0<SminMin1) SminMin0=SminMin1;
	  if(TrendMin<0 && SmaxMin0>SmaxMin1) SmaxMin0=SmaxMin1;

	  if(TrendMax>0 && SminMax0<SminMax1) SminMax0=SminMax1;
	  if(TrendMax<0 && SmaxMax0>SmaxMax1) SmaxMax0=SmaxMax1;

	  if(TrendMid>0 && SminMid0<SminMid1) SminMid0=SminMid1;
	  if(TrendMid<0 && SmaxMid0>SmaxMid1) SmaxMid0=SmaxMid1;


	  if (TrendMin>0) linemin=SminMin0+StepSizeMin;
	  if (TrendMin<0) linemin=SmaxMin0-StepSizeMin;

	  if (TrendMax>0) linemax=SminMax0+StepSizeMax;
	  if (TrendMax<0) linemax=SmaxMax0-StepSizeMax;

	  if (TrendMid>0) linemid=SminMid0+StepSizeMid;
	  if (TrendMid<0) linemid=SmaxMid0-StepSizeMid;

	  bsmin=linemax-StepSizeMax;
	  bsmax=linemax+StepSizeMax;

	  Sto1=(linemin-bsmin)/(bsmax-bsmin);
	  Sto2=(linemid-bsmin)/(bsmax-bsmin);

	  LineFastBuffer[shift]=Sto1*100;
	  LineSlowBuffer[shift]=Sto2*100;

	  SminMin1=SminMin0;
	  SmaxMin1=SmaxMin0;

	  SminMax1=SminMax0;
	  SmaxMax1=SmaxMax0;

	  SminMid1=SminMid0;
	  SmaxMid1=SmaxMid0;
	 }
	return(0);
 }
Comments