StepSto_v1_v3
Download script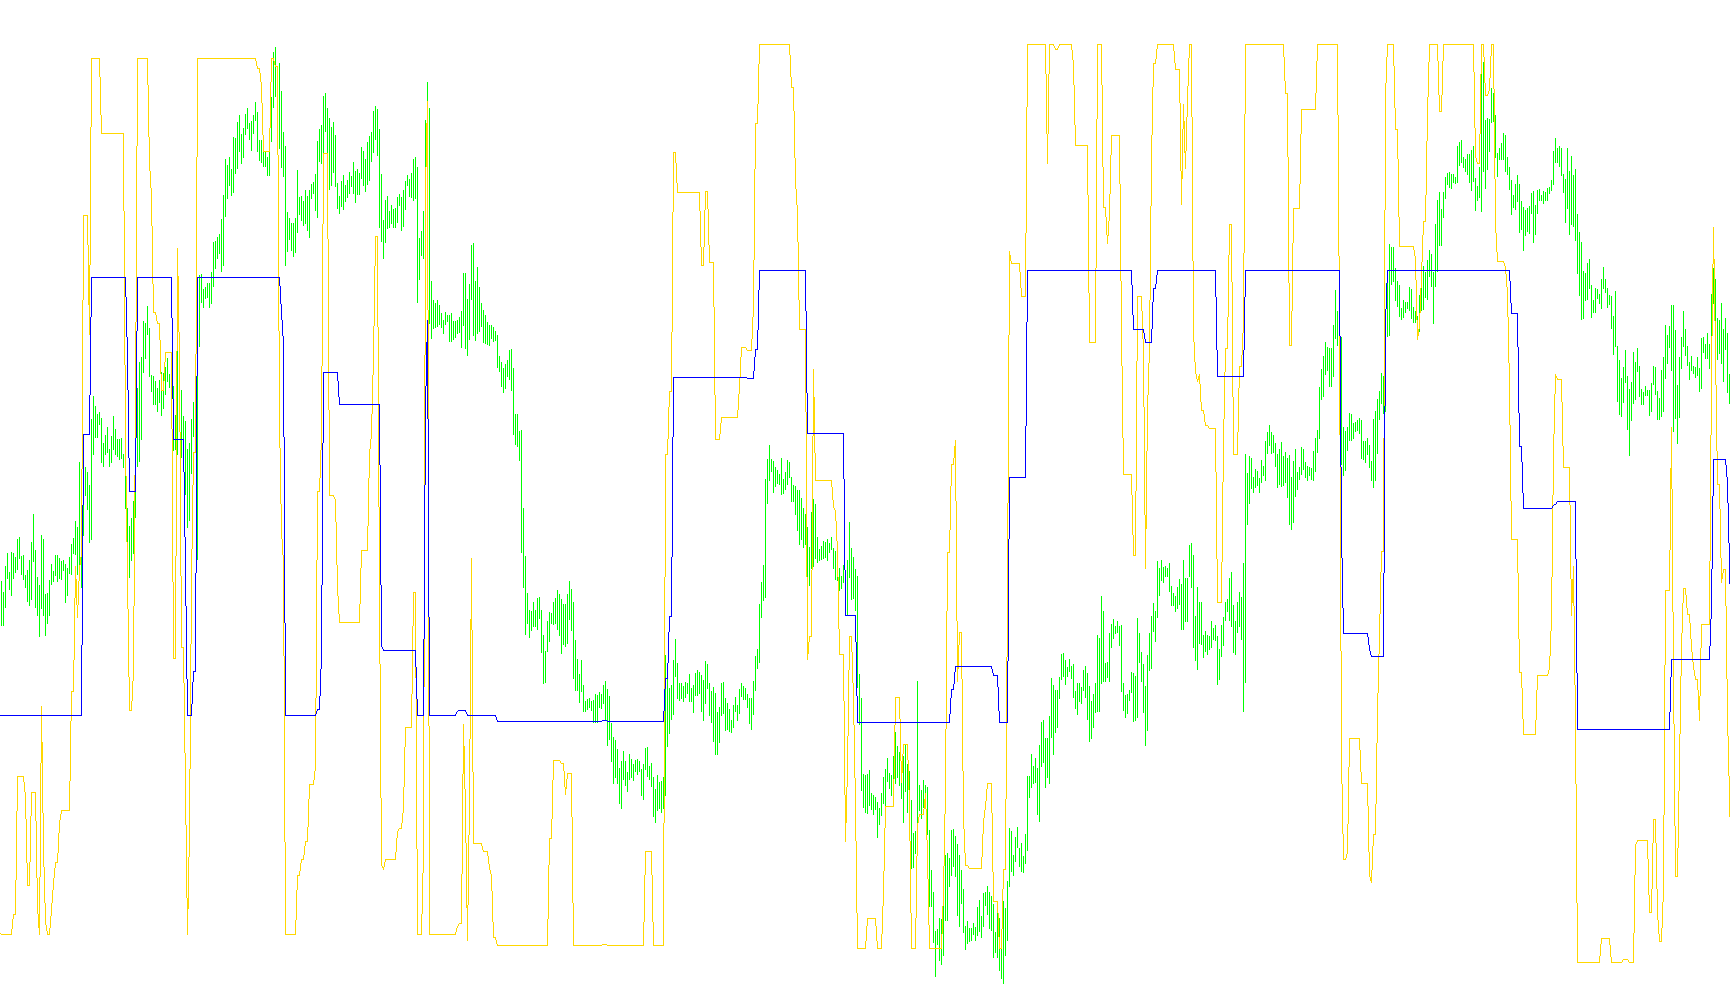
This script, known as the StepSto, is a technical analysis tool designed to help traders identify market trends and momentum by measuring where the current price sits relative to predefined "zones" of movement. Unlike standard oscillators that simply follow the price up and down, this logic creates a structured framework of thresholds based on market volatility.
Core Logic Overview
The indicator works by calculating three distinct levels of "steps" or boundaries. These boundaries are not static; they expand and contract dynamically based on the Average True Range (ATR), which measures how much the price typically moves over a specific period. By using ATR, the tool ensures that its signals remain relevant whether the market is in a high-volatility state or a quiet consolidation phase.
The logic processes three different tiers of trend sensitivity:
- Fast Trend: Based on the smallest recent volatility movements.
- Slow Trend: Based on the largest recent volatility movements.
- Mid Trend: A balanced middle ground between the two.
How the Calculation Works
The script follows a step-by-step logical flow to determine the current market state:
- Volatility Assessment: The tool first looks back at recent price history to identify the minimum and maximum price swings (volatility). It uses these figures to establish "Step Sizes."
- Boundary Mapping: For every point in time, the script creates a series of upper and lower boundaries for all three tiers (Fast, Mid, and Slow).
- Trend Persistence: A key feature of this logic is its "memory." The tool checks if the current price has broken through a previous boundary. If it has, the trend state updates. However, it maintains those boundaries as reference points to track how far the price has moved beyond the initial breakout.
- Relative Positioning: Once the trend direction is established (up or down) and the boundaries are set, the script calculates where the current price sits within the largest possible range (from the lowest "Fast" boundary to the highest "Slow" boundary).
Visual Output
The final result is presented as two distinct lines in a separate window on your chart:
- The Fast Line: Represents the high-sensitivity momentum. It reacts quickly to small price shifts.
- The Slow Line: Represents the broader, more stable market trend.
By comparing these two lines against fixed levels (typically 30 and 70), traders can visualize whether the price is overextended, entering a new trend phase, or moving with steady momentum. Essentially, it translates complex volatility math into a simplified visual representation of "where we are" relative to "where the market has been."
//+------------------------------------------------------------------+
//|                                                   StepSto_v1.mq4 |
//|                           Copyright © 2005, TrendLaboratory Ltd. |
//|            http://finance.groups.yahoo.com/group/TrendLaboratory |
//|                                       E-mail: igorad2004@list.ru |
//+------------------------------------------------------------------+
#property copyright "Copyright © 2005, TrendLaboratory Ltd."
#property link      "http://finance.groups.yahoo.com/group/TrendLaboratory"
//----
#property indicator_separate_window
#property indicator_minimum 0
#property indicator_maximum 100
#property indicator_level1 30
#property indicator_level2 70
#property indicator_buffers 2
#property indicator_color1 Red
#property indicator_color2 DeepSkyBlue
//---- input parameters
extern double Kfast=1.0000;
extern double Kslow=1.0000;
//---- indicator buffers
double LineFastBuffer[];
double LineSlowBuffer[];
//+------------------------------------------------------------------+
//| Custom indicator initialization function                         |
//+------------------------------------------------------------------+
  int init()
  {
   string short_name;
//---- indicator line
   SetIndexStyle(0,DRAW_LINE,STYLE_SOLID,1);
   SetIndexStyle(1,DRAW_LINE,STYLE_SOLID,1);
   SetIndexBuffer(0,LineFastBuffer);
   SetIndexBuffer(1,LineSlowBuffer);
   IndicatorDigits(MarketInfo(Symbol(),MODE_DIGITS));
//---- name for DataWindow and indicator subwindow label
   short_name="StepSto("+Kfast+","+Kslow+")";
   IndicatorShortName(short_name);
   SetIndexLabel(0,"StepSto Fast");
   SetIndexLabel(1,"StepSto Slow");
//----
   SetIndexDrawBegin(0,10);
   SetIndexDrawBegin(1,10);
//----
   return(0);
  }
//+------------------------------------------------------------------+
//| StepSto_v1                                                       |
//+------------------------------------------------------------------+
int start()
  {
   int      shift,TrendMin,TrendMax,TrendMid;
   double   SminMin0,SmaxMin0,SminMin1,SmaxMin1,ATR0,ATRmax,ATRmin;
   double   SminMax0,SmaxMax0,SminMax1,SmaxMax1,SminMid0,SmaxMid0,SminMid1,SmaxMid1;
   double   linemin,linemax,linemid,Sto1,Sto2,bsmin,bsmax;
   double   PeriodATR=10;
   for(shift=Bars-1-PeriodATR;shift>=0;shift--)
     {
      ATR0=iATR(NULL,0,PeriodATR,shift);
      ATRmax=MathMax(ATR0,ATRmax);
      if (shift==Bars-1-PeriodATR) ATRmin=ATR0;
      ATRmin=MathMin(ATR0,ATRmin);
//----
      double StepSizeMin=(Kfast*ATRmin);
      double StepSizeMax=(Kfast*ATRmax);
      double StepSizeMid=(Kfast*0.5*Kslow*(ATRmax+ATRmin));
//----
      SmaxMin0=Close[shift]+2*StepSizeMin;
      SminMin0=Close[shift]-2*StepSizeMin;
      SmaxMax0=Close[shift]+2*StepSizeMax;
      SminMax0=Close[shift]-2*StepSizeMax;
      SmaxMid0=Close[shift]+2*StepSizeMid;
      SminMid0=Close[shift]-2*StepSizeMid;
//----
      if(Close[shift]>SmaxMin1) TrendMin=1;
      if(Close[shift]<SminMin1) TrendMin=-1;
      if(Close[shift]>SmaxMax1) TrendMax=1;
      if(Close[shift]<SminMax1) TrendMax=-1;
      if(Close[shift]>SmaxMid1) TrendMid=1;
      if(Close[shift]<SminMid1) TrendMid=-1;
      if(TrendMin>0 && SminMin0<SminMin1) SminMin0=SminMin1;
      if(TrendMin<0 && SmaxMin0>SmaxMin1) SmaxMin0=SmaxMin1;
      if(TrendMax>0 && SminMax0<SminMax1) SminMax0=SminMax1;
      if(TrendMax<0 && SmaxMax0>SmaxMax1) SmaxMax0=SmaxMax1;
      if(TrendMid>0 && SminMid0<SminMid1) SminMid0=SminMid1;
      if(TrendMid<0 && SmaxMid0>SmaxMid1) SmaxMid0=SmaxMid1;
      if (TrendMin>0) linemin=SminMin0+StepSizeMin;
      if (TrendMin<0) linemin=SmaxMin0-StepSizeMin;
      if (TrendMax>0) linemax=SminMax0+StepSizeMax;
      if (TrendMax<0) linemax=SmaxMax0-StepSizeMax;
      if (TrendMid>0) linemid=SminMid0+StepSizeMid;
      if (TrendMid<0) linemid=SmaxMid0-StepSizeMid;
//----
      bsmin=linemax-StepSizeMax;
      bsmax=linemax+StepSizeMax;
      Sto1=(linemin-bsmin)/(bsmax-bsmin);
      Sto2=(linemid-bsmin)/(bsmax-bsmin);
      LineFastBuffer[shift]=Sto1*100;
      LineSlowBuffer[shift]=Sto2*100;
      SminMin1=SminMin0;
      SmaxMin1=SmaxMin0;
      SminMax1=SminMax0;
      SmaxMax1=SmaxMax0;
      SminMid1=SminMid0;
      SmaxMid1=SmaxMid0;
     }
   return(0);
  }
//+------------------------------------------------------------------+
Comments