StepRSI_v2_v2
Download script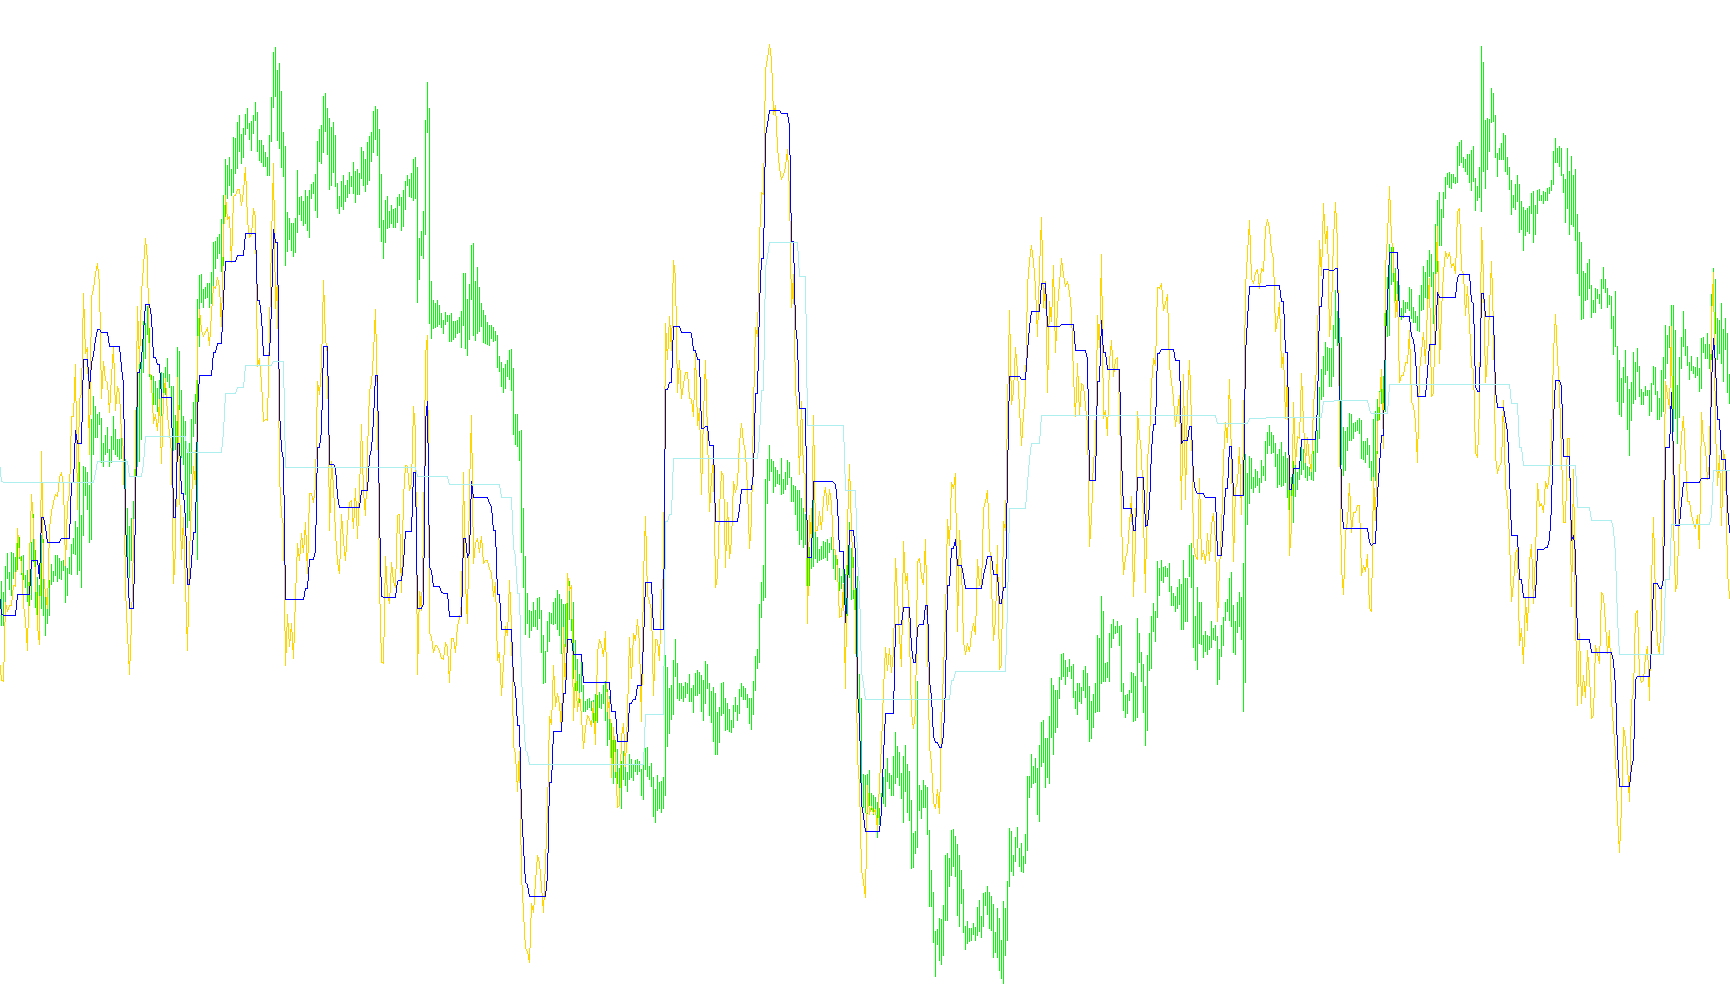
The StepRSI indicator is a specialized technical analysis tool designed to help traders visualize market momentum and identify potential trend reversals or exhaustion points. While it is based on the standard Relative Strength Index (RSI), it incorporates an advanced "stepping" logic that smooths out the data into distinct levels, making it easier to interpret market behavior at a glance.
Core Functionality
At its heart, the script calculates three separate visual components:
- The Base RSI: This is the standard momentum reading, showing the current strength of the price movement.
- Fast StepRSI: A reactive layer that moves quickly with price fluctuations to capture immediate shifts in sentiment.
- Slow StepRSI: A more conservative layer that filters out "noise," highlighting long-term trends and broader market movements.
How the Logic Works
The indicator operates by creating invisible boundaries around the RSI values. Instead of simply showing a continuous line that bounces up and down, the logic follows these principles:
- Trend Detection: The script constantly monitors whether the current RSI value has broken past specific "step" thresholds (defined by Fast and Slow settings). When the price breaks out of these zones, the indicator identifies a new trend direction.
- Memory Logic: One of the key features of this script is its ability to "remember" previous boundaries. If the momentum continues in a specific direction, the indicator holds onto the previous boundary level until a significant enough move occurs to break it. This prevents the lines from jittering back and forth constantly.
- Dynamic Boundaries: By calculating these steps mathematically, the tool creates visual "envelopes." When the RSI is moving aggressively, the steps expand; when the momentum settles, the steps contract.
Practical Interpretation
For a trader, this logic provides a clearer picture of market dynamics than a standard RSI:
- Momentum Confirmation: By looking at both the Fast and Slow StepRSI lines, you can see if short-term momentum is aligned with long-term trends.
- Breakout Identification: Because the lines move in "steps" rather than smooth curves, they highlight when price action has gained enough strength to fundamentally shift the trend.
- Visual Clarity: The three distinct lines allow you to differentiate between temporary volatility (Fast) and established market direction (Slow), helping to reduce "false signals" often found in standard indicators.
Indicators Used
Miscellaneous
12
Views
0
Downloads
0
Favorites
StepRSI_v2_v2
/*-----------------------------+
|			       |
| Shared by www.Aptrafx.com    |
|			       |
+------------------------------*/

//+------------------------------------------------------------------+
//|                                                   StepRSI_v2.mq4 |
//|                           Copyright © 2005, TrendLaboratory Ltd. |
//|                                       E-mail: igorad2004@list.ru |
//+------------------------------------------------------------------+
#property copyright "Copyright © 2005, TrendLaboratory Ltd."
#property link      "E-mail: igorad2004@list.ru"

#property indicator_separate_window
#property indicator_minimum 20
#property indicator_maximum 80
#property indicator_buffers 3
#property indicator_color1 Orange
#property indicator_color2 SkyBlue
#property indicator_color3 Magenta
//---- input parameters
extern int PeriodRSI=14;
extern int StepSizeFast=5;
extern int StepSizeSlow=15;
//extern int HighLow=0;
//---- indicator buffers
double Line1Buffer[];
double Line2Buffer[];
double Line3Buffer[];
//+------------------------------------------------------------------+
//| Custom indicator initialization function                         |
//+------------------------------------------------------------------+
  int init()
  {
   string short_name;
//---- indicator line
   SetIndexStyle(0,DRAW_LINE,STYLE_SOLID,1);
   SetIndexStyle(1,DRAW_LINE,STYLE_SOLID,1);
   SetIndexStyle(2,DRAW_LINE,STYLE_SOLID,1);
   SetIndexBuffer(0,Line1Buffer);
   SetIndexBuffer(1,Line2Buffer);
   SetIndexBuffer(2,Line3Buffer);
   IndicatorDigits(MarketInfo(Symbol(),MODE_DIGITS));
//---- name for DataWindow and indicator subwindow label
   short_name="StepRSI("+PeriodRSI+","+StepSizeFast+","+StepSizeSlow+")";
   IndicatorShortName(short_name);
   SetIndexLabel(0,"RSI");
   SetIndexLabel(1,"StepRSI fast");
   SetIndexLabel(2,"StepRSI slow");
//----
   SetIndexDrawBegin(0,1);
   SetIndexDrawBegin(1,1);
   SetIndexDrawBegin(2,1);
//----
   return(0);
  }

//+------------------------------------------------------------------+
//| StepRSI_v2                                                         |
//+------------------------------------------------------------------+
int start()
  {
   int shift,ftrend,strend;
   double fmin0,fmax0,fmin1,fmax1,smin0,smax0,smin1,smax1,RSI0;


   for(shift=Bars-1;shift>=0;shift--)
   {
   RSI0=iRSI(NULL,0,PeriodRSI,PRICE_CLOSE,shift);

	  fmax0=RSI0+2*StepSizeFast;
	  fmin0=RSI0-2*StepSizeFast;

	  if (RSI0>fmax1)  ftrend=1;
	  if (RSI0<fmin1)  ftrend=-1;

	  if(ftrend>0 && fmin0<fmin1) fmin0=fmin1;
	  if(ftrend<0 && fmax0>fmax1) fmax0=fmax1;

	  smax0=RSI0+2*StepSizeSlow;
	  smin0=RSI0-2*StepSizeSlow;

	  if (RSI0>smax1)  strend=1;
	  if (RSI0<smin1)  strend=-1;

	  if(strend>0 && smin0<smin1) smin0=smin1;
	  if(strend<0 && smax0>smax1) smax0=smax1;


	  Line1Buffer[shift]=RSI0;

	  if (ftrend>0) Line2Buffer[shift]=fmin0+StepSizeFast;
	  if (ftrend<0) Line2Buffer[shift]=fmax0-StepSizeFast;

	  if (strend>0) Line3Buffer[shift]=smin0+StepSizeSlow;
	  if (strend<0) Line3Buffer[shift]=smax0-StepSizeSlow;

	  fmin1=fmin0;
	  fmax1=fmax0;
	  smin1=smin0;
	  smax1=smax0;
	 }
	return(0);
 }
Comments