SnakeForce~
Download script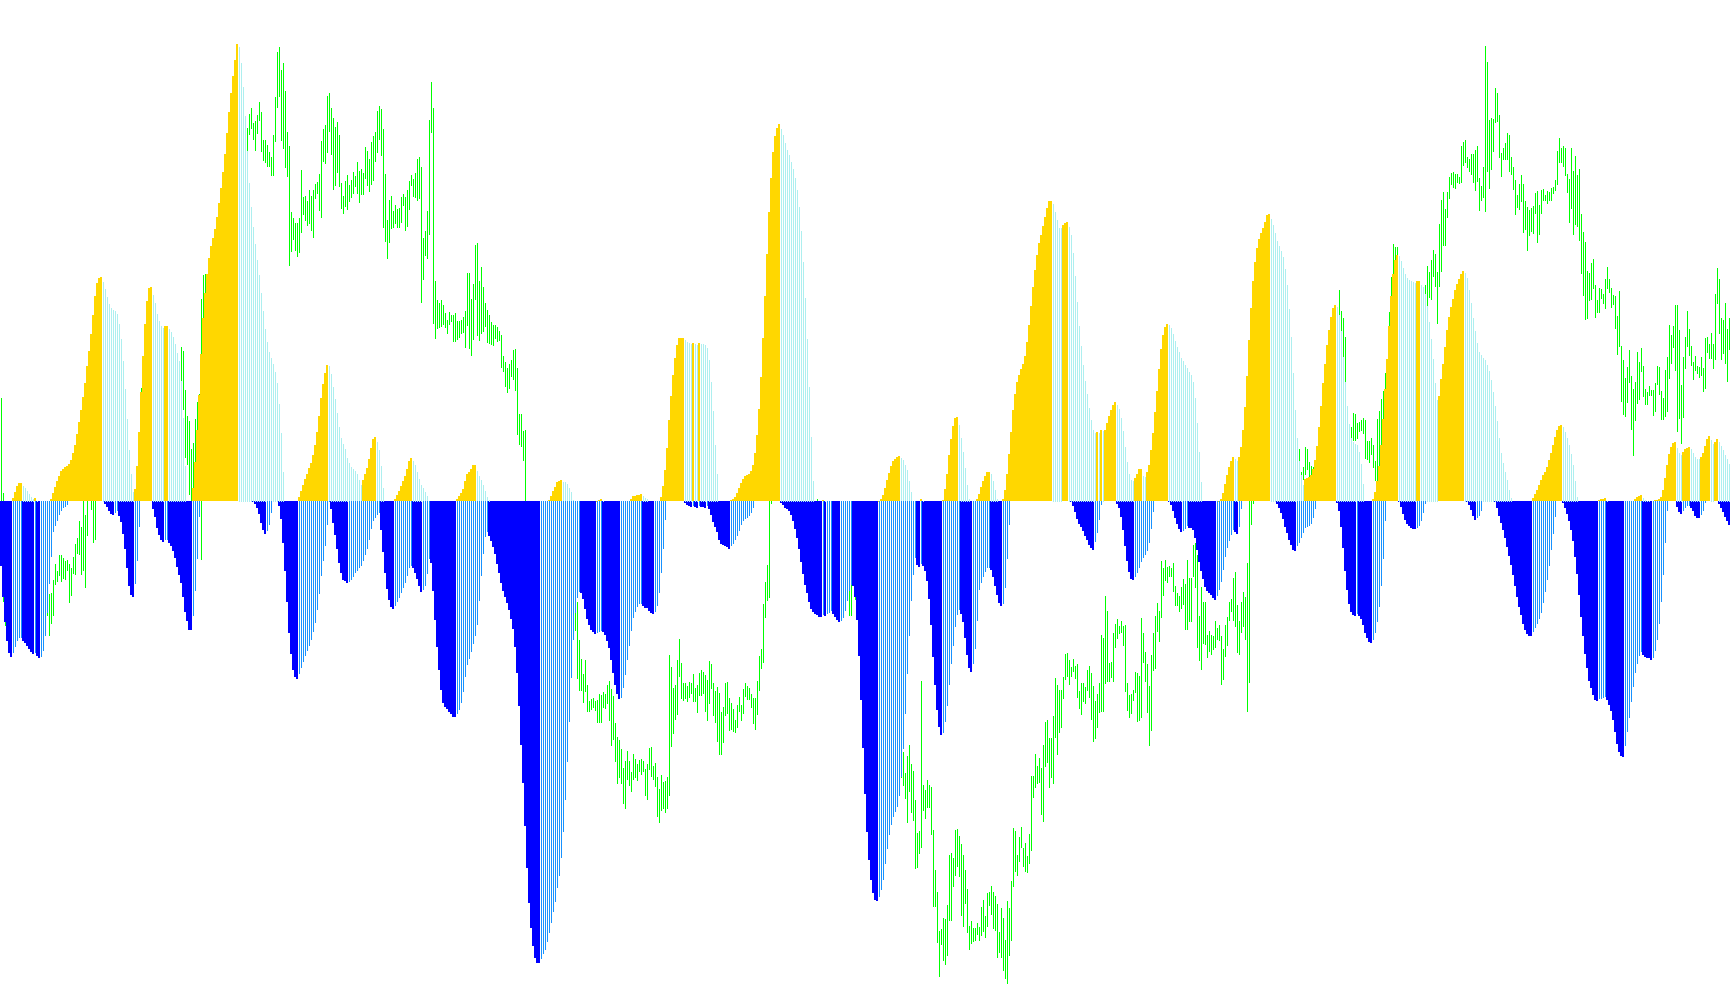
This script is a specialized technical analysis tool designed to monitor and visualize price trends on a financial chart. Rather than simply showing the current price, it uses a unique smoothing logic—metaphorically named "Snake"—to filter out market noise and identify the underlying direction of price movement.
Core Functionality
1. Trend Smoothing (The "Snake" Logic) The primary engine of this script is a weighted moving calculation. It doesn't look at the price in isolation; instead, it evaluates the relationship between current prices and a series of previous data points over a specific user-defined period. By calculating these weighted averages, the tool creates a smoother path that reveals whether the market is trending upward, downward, or remaining stagnant.
2. Dynamic Timeframe Adaptation The script is designed to be intelligent regarding the timeframe you are viewing. It automatically detects whether you are looking at a Minute (M), Hour (H), or Day (D) chart and adjusts its internal labeling and calculation labels accordingly. This ensures that the visual data remains consistent and readable regardless of the zoom level of your trading view.
3. Visual Signal Generation The script translates complex mathematical calculations into clear visual cues:
- Trend Detection: It calculates the distance between the current smoothed price and the highest/lowest points over a specific lookback period.
- Directional Highlights: Based on these calculations, it generates visual histograms (represented by different colors). These act as indicators of "force"—showing where momentum is pushing the price upward or downward.
- Baseline Comparison: The tool compares current movement against recent peaks and valleys to determine if a move is significant enough to be displayed as a trend signal.
Summary for Traders
Think of this script as a high-tech filter. While standard price charts can be "jittery" and confusing, this tool smooths those vibrations out to show you the "true" path of the market. It identifies momentum by measuring how far the price is deviating from its recent highs and lows, highlighting active trends with visual bars that help traders see the direction of the market at a glance.
/*
   Generated by EX4-TO-MQ4 decompiler V4.0.224.1 []
   Website: http://purebeam.biz
   E-mail : purebeam@gmail.com
*/

#property indicator_separate_window
#property indicator_buffers 4
#property indicator_color1 Lime
#property indicator_color2 Red
#property indicator_color3 Lime
#property indicator_color4 Red

extern int cPeriod = 24;
double g_ibuf_80[];
double g_ibuf_84[];
double g_ibuf_88[];
double g_ibuf_92[];
double g_ibuf_96[];
double gd_100;
double gd_108;
double gd_116;
double gd_124;

int init() {
   double ld_12;
   string ls_28;
   int li_0 = 3 * cPeriod;
   IndicatorBuffers(5);
   SetIndexBuffer(0, g_ibuf_80);
   SetIndexBuffer(1, g_ibuf_84);
   SetIndexBuffer(2, g_ibuf_88);
   SetIndexBuffer(3, g_ibuf_92);
   SetIndexBuffer(4, g_ibuf_96);
   SetIndexStyle(0, DRAW_HISTOGRAM, EMPTY, 2);
   SetIndexStyle(1, DRAW_HISTOGRAM, EMPTY, 2);
   SetIndexStyle(2, DRAW_HISTOGRAM);
   SetIndexStyle(3, DRAW_HISTOGRAM);
   SetIndexStyle(4, DRAW_NONE);
   SetIndexLabel(2, NULL);
   SetIndexLabel(3, NULL);
   SetIndexLabel(4, NULL);
   SetIndexDrawBegin(0, li_0);
   SetIndexDrawBegin(1, li_0);
   SetIndexDrawBegin(2, li_0);
   SetIndexDrawBegin(3, li_0);
   SetIndexDrawBegin(4, li_0);
   double ld_4 = 1.0 * cPeriod * Period();
   if (ld_4 < 60.0) {
      ls_28 = DoubleToStr(ld_4, 0);
      ls_28 = " M" + ls_28 + ", FORCE UP -DOWN ";
   } else {
      ld_4 /= 60.0;
      if (ld_4 >= 24.0) {
         ld_12 = MathAbs(MathRound(ld_4 / 24.0) - ld_4 / 24.0);
         if (ld_12 < 0.01) {
            ls_28 = DoubleToStr(ld_4 / 24.0, 0);
            ls_28 = " D" + ls_28 + ", FORCE UP -DOWN ";
         } else {
            ls_28 = DoubleToStr(ld_4 / 24.0, 1);
            ls_28 = " D" + ls_28 + ", FORCE UP -DOWN ";
         }
      } else {
         ld_12 = MathAbs(MathRound(ld_4) - ld_4);
         if (ld_12 < 0.01) {
            ls_28 = DoubleToStr(ld_4, 0);
            ls_28 = " H" + ls_28 + ", FORCE UP -DOWN ";
         } else {
            ls_28 = DoubleToStr(ld_4, 1);
            ls_28 = " H" + ls_28 + ", FORCE UP -DOWN ";
         }
      }
   }
   IndicatorShortName("SnakeInBorders" + ls_28);
   return (0);
}

void deinit() {
}

int start() {
   int li_4 = 0;
   if (Bars <= 50) return (0);
   if (cPeriod < 21) return (0);
   li_4 = IndicatorCounted();
   if (li_4 < 0) return (-1);
   if (li_4 > 0) li_4--;
   int li_0 = Bars - li_4 - 1;
   if (li_0 > Bars - cPeriod - 7) {
      li_0 = Bars - cPeriod - 7;
      g_ibuf_96[li_0 + cPeriod] = SnakeFirstCalc(li_0 + cPeriod);
      for (int li_8 = li_0 + cPeriod - 1; li_8 > li_0; li_8--) SnakeNextCalc(li_8);
   }
   Snake(li_0);
   return (0);
}

void Snake(int ai_0) {
   if (ai_0 < 6) ai_0 = 6;
   g_ibuf_96[ai_0] = SnakeFirstCalc(ai_0);
   Drawing(ai_0);
   for (ai_0--; ai_0 >= 5; ai_0--) {
      g_ibuf_96[ai_0] = SnakeNextCalc(ai_0);
      Drawing(ai_0);
   }
   while (ai_0 > 0) {
      g_ibuf_96[ai_0] = SnakeFirstCalc(ai_0);
      Drawing(ai_0);
      ai_0--;
   }
   if (ai_0 == 0) {
      g_ibuf_96[ai_0] = iMA(NULL, 0, 6, 0, MODE_LWMA, PRICE_CLOSE, 0);
      Drawing(ai_0);
   }
}

double SnakePrice(int ai_0) {
   return (Close[ai_0]);
}

double SnakeFirstCalc(int ai_0) {
   int l_count_4;
   int li_8;
   gd_100 = 0.0;
   if (ai_0 < 5) {
      gd_108 = 0.0;
      l_count_4 = 0;
      for (int li_12 = ai_0 + 5; li_12 >= ai_0; li_12--) {
         l_count_4++;
         gd_100 += l_count_4 * SnakePrice(li_12);
         gd_108 += l_count_4;
      }
      while (li_12 >= 0) {
         l_count_4--;
         gd_100 += l_count_4 * SnakePrice(li_12);
         gd_108 += l_count_4;
         li_12--;
      }
   } else {
      gd_116 = 0.0;
      gd_124 = 0.0;
      li_8 = ai_0 - 5;
      l_count_4 = ai_0 + 5;
      for (li_12 = 1; li_12 <= 5; li_12++) {
         gd_100 += li_12 * (SnakePrice(l_count_4) + SnakePrice(li_8));
         gd_116 += SnakePrice(l_count_4);
         gd_124 += SnakePrice(li_8);
         li_8++;
         l_count_4--;
      }
      gd_100 += 6.0 * SnakePrice(ai_0);
      gd_116 += SnakePrice(ai_0);
      gd_108 = 36;
   }
   return (gd_100 / gd_108);
}

double SnakeNextCalc(int ai_0) {
   gd_124 += SnakePrice(ai_0 - 5);
   gd_100 = gd_100 - gd_116 + gd_124;
   gd_116 = gd_116 - SnakePrice(ai_0 + 6) + SnakePrice(ai_0);
   gd_124 -= SnakePrice(ai_0);
   return (gd_100 / gd_108);
}

void Drawing(int ai_0) {
   double ld_4 = 5.0 * (g_ibuf_96[ai_0] - g_ibuf_96[ArrayMinimum(g_ibuf_96, cPeriod, ai_0)]) / 9.0;
   double ld_12 = 5.0 * (g_ibuf_96[ai_0] - (g_ibuf_96[ai_0 + 1]) + g_ibuf_96[ArrayMinimum(g_ibuf_96, cPeriod, ai_0 + 1)] - g_ibuf_96[ArrayMinimum(g_ibuf_96, cPeriod, ai_0)]) / 9.0;
   if (ld_12 > 0.0) {
      g_ibuf_80[ai_0] = ld_4;
      g_ibuf_88[ai_0] = 0;
   } else {
      g_ibuf_80[ai_0] = 0;
      g_ibuf_88[ai_0] = ld_4;
   }
   ld_4 = 5.0 * (g_ibuf_96[ai_0] - g_ibuf_96[ArrayMaximum(g_ibuf_96, cPeriod, ai_0)]) / 9.0;
   ld_12 = 5.0 * (g_ibuf_96[ai_0] - (g_ibuf_96[ai_0 + 1]) + g_ibuf_96[ArrayMaximum(g_ibuf_96, cPeriod, ai_0 + 1)] - g_ibuf_96[ArrayMaximum(g_ibuf_96, cPeriod, ai_0)]) / 9.0;
   if (ld_12 < 0.0) {
      g_ibuf_84[ai_0] = ld_4;
      g_ibuf_92[ai_0] = 0;
      return;
   }
   g_ibuf_84[ai_0] = 0;
   g_ibuf_92[ai_0] = ld_4;
}
Comments